Miscellaneous earnings and costs
Financial stability (RAS)
Accounts receivable and payable
Revenue
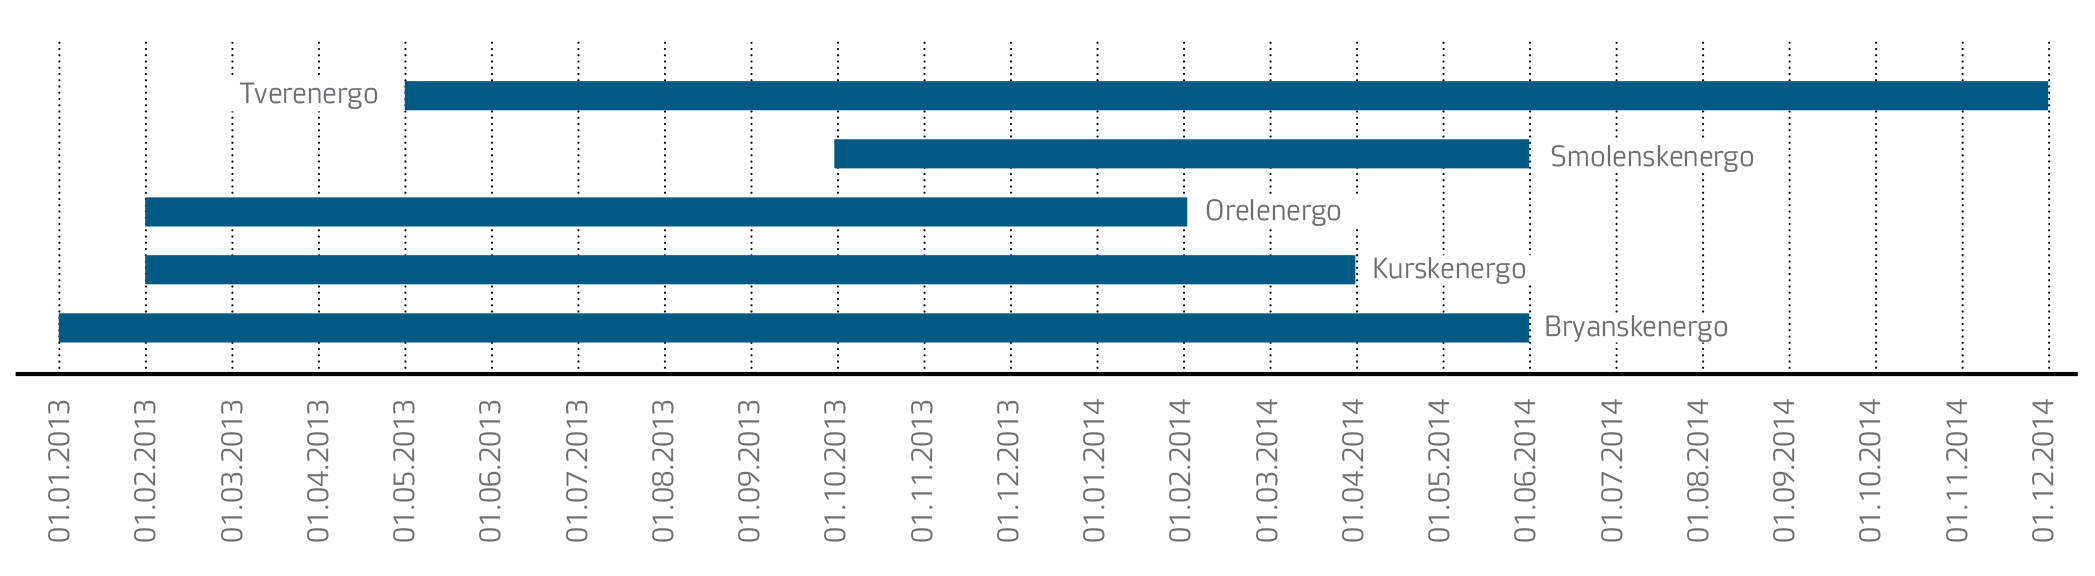
Five branches of the Company acted as guaranteeing suppliers of electricity pursuant to resolutions of the Ministry of Energy of the Russian Federation in 2013–2014.
Due to accounting features, earnings from electricity sales actually include a part of the Company’s revenue from electricity transmission services. The revenue from electricity transmission and revenue from electricity sales adjusted in view of this fact are shown in the table below.
Under 2014 results, the Company’s revenue amounted to RUB 86.7bn. The reduction of earnings by RUB 6.2bn (–6.7%) is due to the fact that the functions of guaranteeing suppliers were transferred to companies that won tenders of the Ministry of Energy of the Russian Federation in 2014.
The revenue from electricity sales in 2014 was RUB 0.7bn (0.9%) greater than the 2013 revenue. Such dynamics were due to tariff growth in the reporting year and cost reduction by 1.2% (by 0.07bn kWh).
In 2014, the revenue from grid connection services amounted to RUB 1.5bn, which is a 66.7% vs. 2013. This growth is due to fulfilment of major grid connection contracts at Voronezhenergo, Kurskenergo, and Tverenergo in the reporting year.
The key revenue parameters in 2012–2014 were as follows (RAS), RUB bn
| Parameter |
2012 |
2013 |
2014 |
Deviation, 2014/2013 |
|
|
|
|
RUB bn |
% |
| Revenue |
69.4 |
92.9 |
86.7 |
—6.2 |
—6.7 |
| In particular: |
|
|
|
|
|
| electricity transmission, RAS |
67.5 |
61.4 |
69.2 |
7.8 |
12.7 |
| electricity transmission, adjusted |
67.5 |
75.2 |
75.9 |
0.7 |
0.9 |
| grid connection |
1.2 |
0.9 |
1.5 |
0.6 |
66.7 |
| electricity sales, RAS |
— |
29.8 |
15.1 |
—14.7 |
—49.3 |
| electricity sales, adjusted |
— |
16.0 |
8.3 |
7.7 |
—48.1 |
| miscellaneous |
0.73 |
0.86 |
1.01 |
0.15 |
17.4 |
The periods when branches of the Company had sales functions were as follows
The revenue from other business amounted to RUB 1.01bn, which is a RUB 0.15bn (17.4%) increase in comparison to 2013. The increase is due to the following factors:
- RUB 0.067bn were earnings from lease that were included in revenue from other business. In 2013 and before such revenue was included in the Other earnings item;
- RUB 0.094bn was revenue from the sale of non-core assets;
- RUB 0.071bn was an increase of revenue from other services related to a greater amount of provided repair and maintenance services, engineering services, and other jobs.
Production cost
The production cost of electricity transmission services and the production cost of electricity sales are shown in accordance with RAS statements and adjusted in view of the fact that some of the electricity transmission costs were included in the production cost of electricity sales.
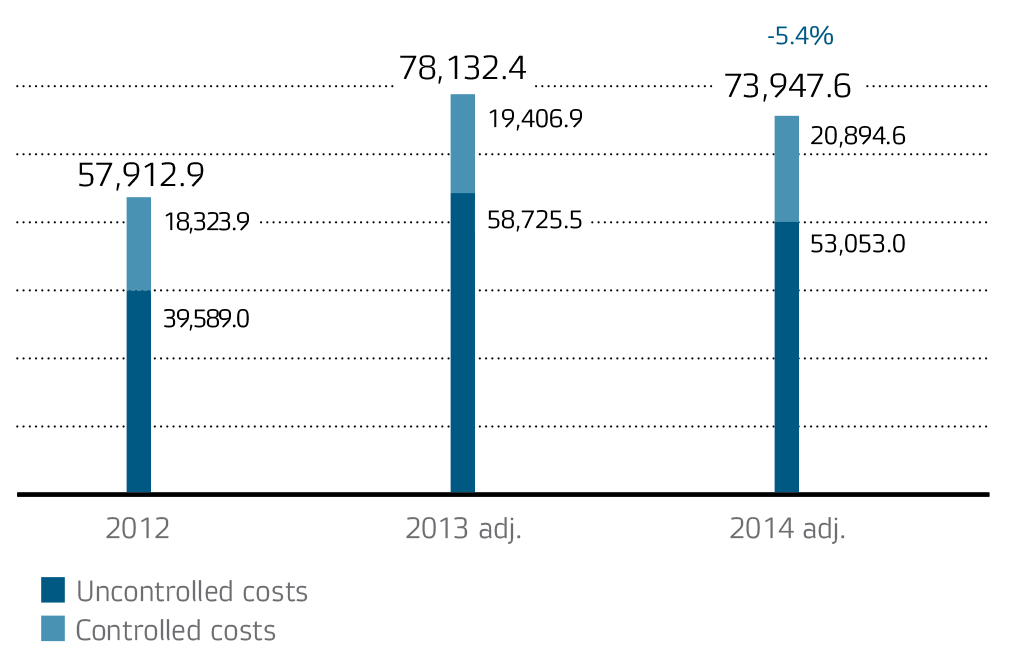
The reduction in production costs as compared to 2013 by RUB 4.2bn or 5.4% is due to a reduction of the cost of purchased energy for sale due to the transfer of the guaranteeing supplier function.
Sales and production costs (adj.), RUB mln
The structure of production and sale costs in 2012–2014 was as follows (adj.), RUB mln
| Parameter |
2012 |
2013 |
2014 |
Deviation, 2014/2013 |
|
|
|
|
RUB mln |
% |
| Uncontrolled costs, total |
39,589.0 |
58,725.5 |
53,053.0 |
—5,672.5 |
—9.7 |
| In particular: |
|
|
|
|
|
| costs of compensation of lossesIn 2014, purchased electricity for compensation of losses as part of the production costs is shown including the ‘internal circulation’ (RUB 1.1bn) and the cost of the sale surcharge and infrastructure charges (RUB 0.2bn). |
8,251.1 |
9,864.7 |
9,833.7 |
—31.0 |
—0.3 |
| services of JSC FGC UES |
13,340.4 |
14,729.5 |
15,351.5 |
622.0 |
4.2 |
| services of territorial grid companies |
11,713.4 |
12,442.6 |
12,169.8 |
—272.8 |
—2.2 |
| amortisation of fixed and intangible assets |
6,284.1 |
7,542.4 |
8,359.7 |
817.3 |
10.8 |
| purchased electricity for sale |
— |
14,146.3 |
7,338.3 |
—6,808.0 |
—48.1 |
| Controlled costs, total |
18,323.9 |
19,406.9 |
20,894.6 |
1,487.7 |
7.7 |
| In particular: |
|
|
|
|
|
| material costs |
2,609.2 |
2,683.2 |
2,887.4 |
204.2 |
7.6 |
| services related to production |
942.1 |
806.4 |
708.4 |
—98.0 |
—12.2 |
| staff (payroll, mandatory social security charges, non-government pension funds) |
11,426.3 |
12,328.7 |
13,546.2 |
1,217.5 |
9.9 |
| other costs included in production costs |
3,346.3 |
3,588.6 |
3,752.6 |
164.0 |
4.6 |
| Total costs |
57,912.9 |
78,132.4 |
73,947.6 |
—4,184.8 |
—5.4 |
The dynamics of electricity transmission and sales costs in 2012–2014 was as follows, (adj.), RUB bn
| Parameter |
2012 |
2013 |
2014 |
Deviation, 2014/2013 |
|
|
|
|
RUB bn |
% |
| Production cost |
57.9 |
78.1 |
73.9 |
—4.2 |
—5.4 |
| In particular: |
|
|
|
|
|
| electricity transmission, RAS |
57.3 |
62.9 |
65.6 |
2.7 |
4.3 |
| electricity transmission, adjusted |
57.3 |
63.3 |
65.8 |
2.5 |
3.9 |
| grid connection |
0.25 |
0.29 |
0.31 |
0.02 |
6.9 |
| electricity sales, RAS |
— |
14.5 |
7.5 |
—7.0 |
—48.3 |
| electricity sales, adjusted |
— |
14.1 |
7.3 |
—6.8 |
—48.2 |
| miscellaneous |
0.35 |
0.41 |
0.47 |
0.05 |
11.9 |
- Reduction of the cost of purchased electricity for sale by RUB 6,808mln (48.1%). This reduction was due to the transfer of guaranteeing supplier function pursuant to the decrees of the Ministry of Energy of the Russian Federation in the Bryansk, Kursk, Orel, Tver, and Smolensk Regions.
- Reduction of costs of compensation of electricity losses by RUB 31mln (0.3%) due to a reduction in losses by 75,095k kWh, a reduction of the cost of load losses, and an increase of the weighted average price from 1.80 RUB/kWh to 1.84 RUB/kWh.
- An increase of the cost of services of JSC FGC UES by RUB 622mln (4.2%) due to the increase of the tariffs for electricity transmission services in the United National Electric Grid from 01.07.2014.
- Reduction of costs of services of territorial grid companies by RUB 272.8mln (2.2%) due to a reduction of the transfer balance in the grid of adjacent territorial grid companies.
- Increase of amortisation of fixed and intangible assets by RUB 817.3mln (10.8%) due to commissioning of fixed assets.
- Increase of material costs by RUB 204.2mln (7.6%) due to an increase in material consumption for repair purposes in respect of repairs in 2014 that were made mainly with the company’s own resources.
- Increase of staff costs (payroll, mandatory social security charges, non-government pension funds) by RUB 1,217.5mln (9.9%), which was due to indexation of employees’ salaries. Increase of miscellaneous costs that were included in production costs by RUB 164mln (4.6%) due to an increase in the costs of information and consulting services and property taxes.
- Reduction of the cost of services related to production by RUB 98mln (12.2%), primarily due to repairs in 2014 that were made mainly with the company’s own resources.
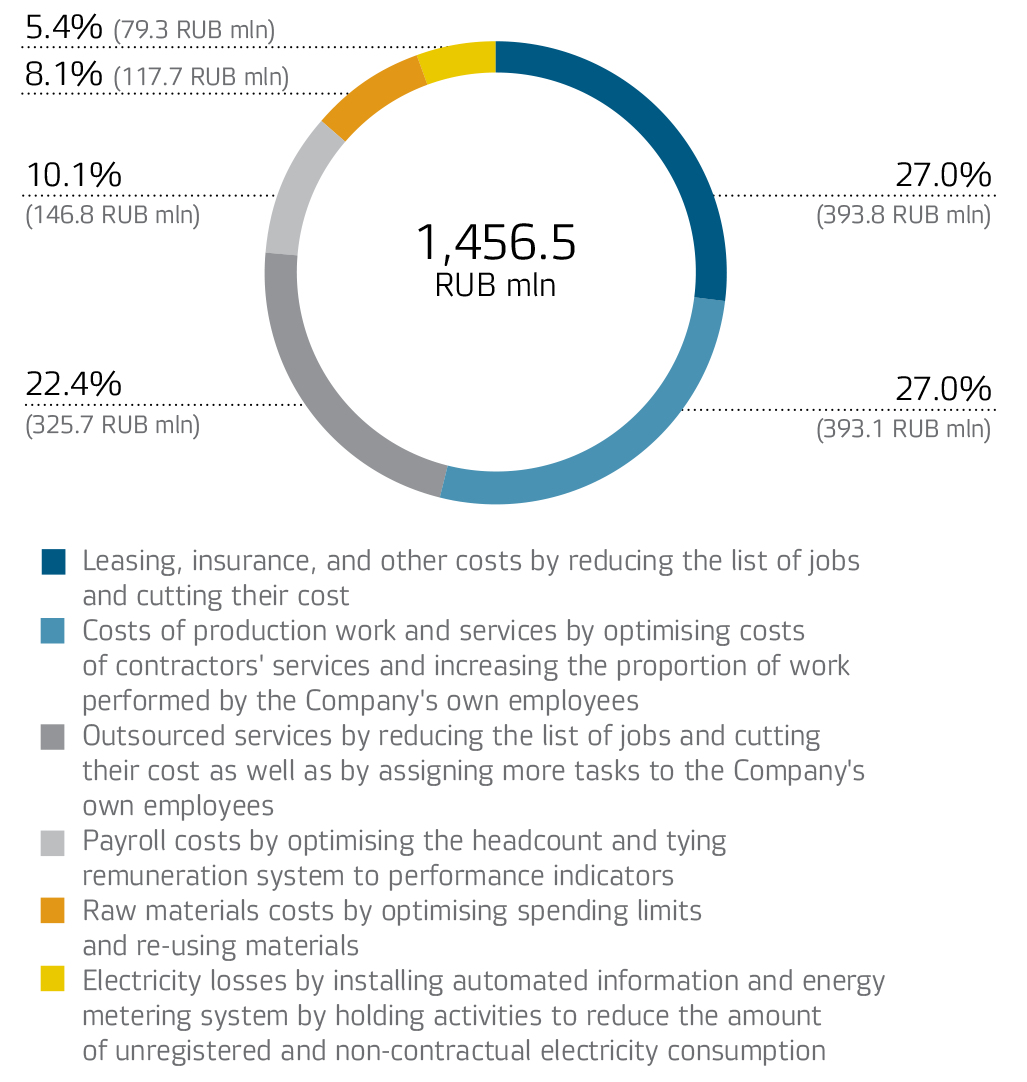
Cost Control Programme
To implement the Russian Power Grid Development Strategy, the Company approved IDGC of Centre Performance Management Programme in 2014. The Strategy provides for a 15% decrease in operating costs by 2017, taking into account the inflation rate vs 2012 per unit of serviced electrical equipment. Based on the actual results of 2014, operating costs fell by 8.8%, taking into account the inflation rate vs 2012 per unit of serviced electrical equipment, with the amount saved totalling RUB 1.46 billion.
Operating cost decrease items, RUB mln
Profit from sales
In 2014, the profit from sales amounted to RUB 10.0bn, which is RUB 1.5bn less than in 2013. The reduction was mainly due to revenue reduction (by RUB 6.2bn), simultaneous reduction of the production cost by RUB 4.2bn, reduction of selling costs by RUB 0.5bn (45%), and reduction of management costs by RUB 0.03bn (1.8%).
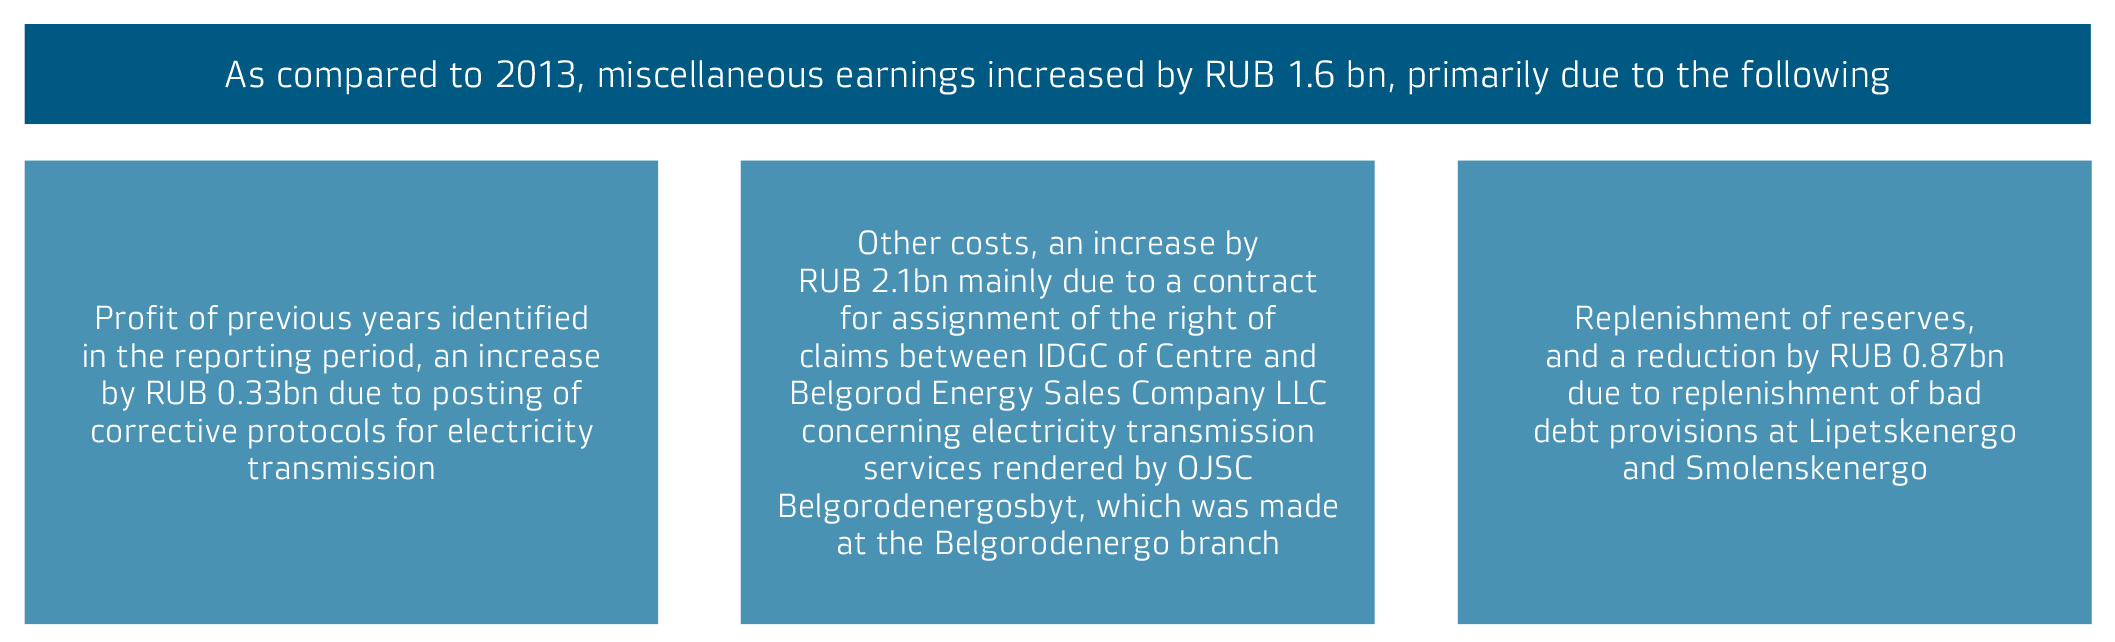
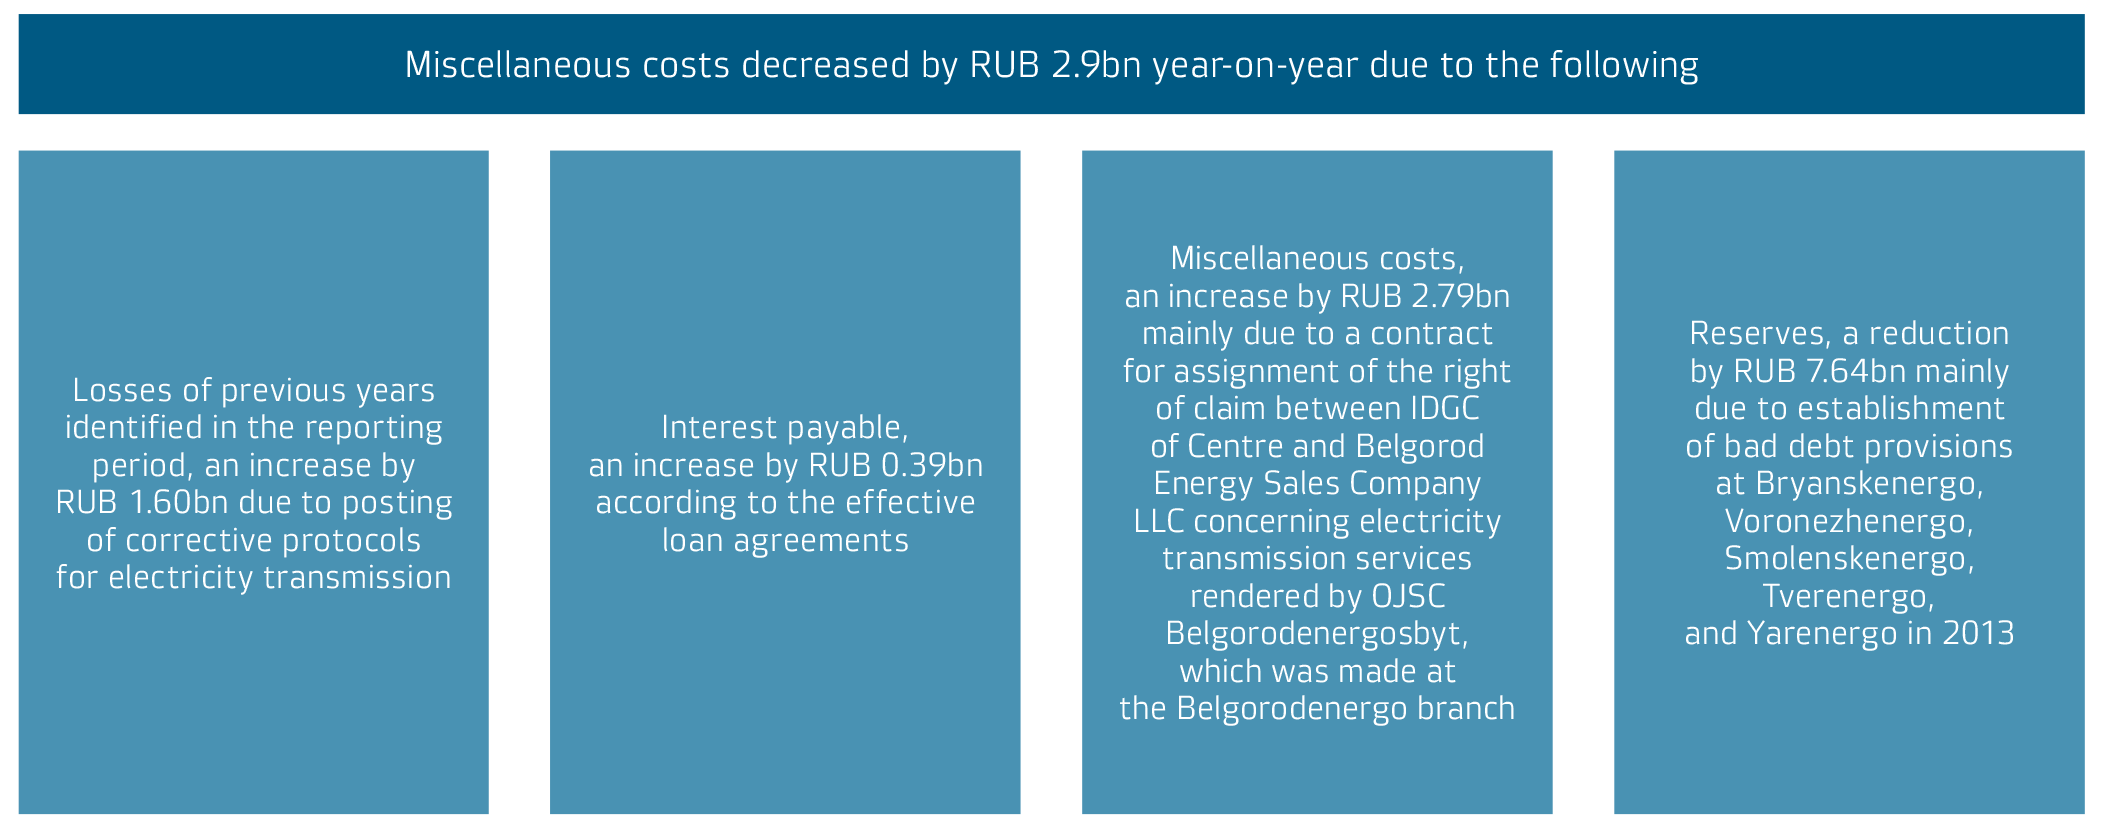
Miscellaneous earnings and costs
Net profit
In 2014, the profit before tax amounted to RUB 4.9bn, which was an increase of RUB 3.0bn in comparison with 2013. The profit tax and other similar mandatory charges amounted to RUB 1.5bn.
In 2014, the net profit amounted to RUB 3.3bn, which was RUB 3.0bn less than in 2013. The increase of the Company’s net profit was largely affected by the reduction of miscellaneous costs by RUB 3.3bn, increase of miscellaneous earnings by RUB 1.6bn, and reduction of selling costs by RUB 0.54bn.
The structure of the net profit in 2012–2014 was as follows, RUB bn
| Parameter |
2012 |
2013 |
2014 |
Deviation, 2014/2013 |
|
|
|
|
RUB bn |
% |
| Net profit |
3.5 |
0.3 |
3.3 |
3.0 |
1,000.0 |
| In particular: |
|
|
|
|
|
| from electricity transmission |
2.4 |
—1.0 |
2.8 |
3.8 |
— |
| from grid connectionThe sum of technical connection liabilities that are included in the net profit. |
0.7 |
0.5 |
0.9 |
0.4 |
80.0 |
| from electricity sales |
— |
0.4 |
—0.8 |
—1.2 |
— |
| other |
0.31 |
0.35 |
0.40 |
0.05 |
14.3 |
The distribution of profits in 2012–2014 pursuant to the resolutions of the General Meeting of Shareholders was as follows
| Parameter |
Measurement unit |
For 2011 |
For 2012 |
For 2013 |
Deviation, 2013/2012 |
|
|
|
|
|
abs. |
% |
| Retained net earnings |
RUB mln |
5,203.5 |
3,450.7 |
292.9 |
—3,157.8 |
—91.5 |
| in particular: |
|
|
|
|
|
|
| Reserve fund |
RUB mln |
— |
— |
— |
— |
— |
| Profit for development |
RUB mln |
4,781.3 |
2,587.8 |
216.9 |
—2,370.9 |
— 91.6 |
| Dividends |
RUB mln |
422.2 |
862.9 |
75.99 |
—786.91 |
— 91.2 |
| Share in the net profit |
% |
8.1 |
25.0 |
25.9 |
0.9 |
— |
| Repayment of losses of previous years |
RUB mln |
— |
— |
— |
— |
— |
| Amount of dividends per 1 share |
RUB |
0.01 |
0.02044 |
0.0018 |
—0.01864 |
— 91.2 |
Financial stability (RAS)
The parameters characterising the financial standing of the Company in 2012–2014 were as follows
| Parameter |
Measurement unit |
2012 |
2013 |
2014 |
Deviation, 2014/2013, p./p.p./% |
| Liquidity ratios |
| Absolute liquidity ratio |
— |
0.07 |
0.07 |
0.02 |
—0.05 |
| Quick liquidity ratio |
— |
1.06 |
1.04 |
0.87 |
—0.17 |
| Current liquidity ratio |
— |
1.16 |
1.19 |
0.96 |
—0.23 |
| Ratio of sufficiency of own working capital |
— |
0.14 |
0.16 |
—0.04 |
—0.2 |
| Ratios of financial stability |
| Net asset value |
RUB bn |
53.5 |
53.0 |
56.2 |
6.0% |
| Ratio of overdue accounts payable |
% |
19 |
9 |
18 |
9 |
| Autonomy (financial independence) ratio |
— |
0.54 |
0.50 |
0.50 |
— |
| Profitability ratios |
|
|
|
|
|
| Profitability of sales by gross profit |
% |
16.6 |
15.9 |
14.7 |
—1.2 |
| Profitability of sales by net profit |
% |
5.0 |
0.3 |
3.8 |
3.5 |
| Operating profitability |
% |
6.5 |
2.1 |
5.6 |
3.5 |
| ROE |
% |
6.4 |
0.6 |
6.1 |
5.5 |
| Profitability by EBITDA |
% |
17.9 |
12.5 |
18.0 |
5.5 |
| Business activity ratios |
|
|
|
|
|
| Turnover of assets |
times |
0.8 |
0.9 |
0.8 |
—11.1% |
| Turnover of accounts receivable |
times |
6.4 |
7.0 |
5.8 |
—17.1% |
| Turnover of accounts payable |
times |
7.4 |
8.6 |
8.7 |
1.2% |
| Ratio of accounts receivable and payable growth rates |
— |
1.1 |
1.0 |
1.5 |
0.5 |
| Ratio of total accounts receivable and payable |
— |
1.2 |
1.2 |
1.8 |
0.6 |
| Ratio of the most liquid accounts receivable and payable |
— |
2.2 |
1.8 |
2.8 |
1.0 |
The reduction of liquidity ratios as of the end of 2014 was due to a change in the liability structure, namely, the move of some loans that are due before the end of 2015 from long-term liabilities to short-term liabilities. In particular:
- As of 31.12.2014, the absolute liquidity ratio was 0.02, which is 0.05 p. less than on 31.12.2013. The reduction of this ratio was also affected by the reduction of the amount of cash and equivalents as of the end of 2014. This ratio characterises the capacity of the Company to pay its short-term liabilities with free cash and short-term financial investments.
- The quick liquidity ratio represents the coverage of short-term liabilities with highly liquid and medium liquidity current assets. As of the end of 2014, this ratio amounted to 0.87.
- The current liquidity ratio as of 31.12.2013 was 1.19. As of 31.12.2014, the value of this ratio was 0.96.
- Despite the growth of current assets in 2014 by RUB 2.7bn, the ratio of sufficiency of own working capital as of 31.12.2014 amounted to —0.04.
The ratio of overdue accounts payable for 2014 increased by 9 p.p. or RUB 0.9bn, which was due to an increase of accounts receivable.
The autonomy (financial independence) ratio as of 31.12.2014 was 0.50. This ratio characterises the share of own funds in the total assets of the Company. It did not change as of the end of 2014.
The profitability ratios characterise the efficiency of the Company’s operations. The profitability of sales by gross profit in 2014 amounted to 14.7%, which is 1.2 p.p. less than last year. The other profitability ratios showed growth as of the end of 2014.
The reasons for the positive dynamics of the profitability ratios were the increase of the Company’s net profit and EBITDA due to a reduction of the established bad debt provisions by RUB 8bn in 2014 as compared to 2013.
The return on equity ratio (ROE) amounted to 6.1% in 2014. This ratio improved in 2014 as compared to 2013, which was due to growth in the Company’s net profit.
The turnover ratios are used for analysis of the efficiency of management of the Company’s liabilities.
The turnover of assets is a financial factor of how efficiently the company uses the total of its assets. Through 2014, the turnover of assets decreased by 11.1% because the revenue went down by RUB 6.2bn. The revenue reduction was due to the fact that the functions of guaranteeing suppliers were transferred to companies that won tenders of the Ministry of Energy of Russia.
The turnover of accounts receivable characterises the speed of repayment of accounts receivable. The turnover of accounts receivable by the results of the financial and business operations in 2014 reduced by 17.1%, which was due to growth of accounts receivable, which was in its turn caused by poor payment discipline of consumers and sales companies and a change in contract terms (transfer to payment for the actual consumption and abandonment of advance payments).
The turnover of accounts payable characterises the speed of repayment of debt to suppliers and contractors. This ratio increased by 1.2% in 2014, which was mainly due to a reduction in accounts payable by RUB 1.5bn.
Accounts receivable and payable
The dynamics of accounts receivable in 2012–2014 was as follows, RUB bn
| Parameter |
2012 |
2013 |
2014 |
Deviation, 2014/2013 |
|
|
|
|
RUB bn |
% |
| Accounts receivable |
13.5 |
13.0 |
16.7 |
3.7 |
28.5% |
| In particular: |
|
|
|
|
|
| buyers and customers |
11.7 |
11.1 |
13.9 |
2.8 |
25.2% |
| notes receivable |
— |
— |
— |
— |
— |
| accrued dividends of subsidiaries and affiliates |
— |
— |
— |
— |
— |
| advances made |
0.49 |
0.17 |
0.43 |
0.26 |
152.9% |
| other debtors |
1.31 |
1.73 |
2.37 |
0.64 |
37.0% |
The increase of accounts receivable by RUB 3.7bn was due to poor payment discipline of consumers and sales companies, in particular:
- An increase in debt for electricity transmission of RUB 4.9bn
- An increase in debt for grid connection of RUB 0.14bn
- A reduction in debt for sold electricity of RUB 2.2bn
The change was due to the fact that the functions of guaranteeing suppliers were transferred to companies that won tenders of the Ministry of Energy of the Russian Federation.
The dynamics of accounts payable in 2012–2014 was as follows, RUB bn
| Parameter |
2012 |
2013 |
2014 |
Deviation, 2014/2013 |
|
|
|
|
RUB bn |
% |
| Accounts payable |
11.0 |
10.7 |
9.2 |
—1.5 |
—14.0 |
| In particular: |
|
|
|
|
|
| suppliers and contractors |
5.6 |
6.2 |
5.3 |
—0.9 |
—14.5 |
| notes payable |
— |
— |
— |
— |
— |
| accrued wages |
0.35 |
0.01 |
0.05 |
0.04 |
400 |
| accrued charges to state extrabudgetary funds |
0.24 |
0.31 |
0.33 |
0.02 |
6.5 |
| accrued taxes and levies |
0.48 |
0.79 |
0.62 |
—0.17 |
—21.5 |
| advances received |
4.05 |
2.6 |
2.3 |
—0.3 |
—11.5 |
| accrued dividends |
0.01 |
0.02 |
0.01 |
—0.01 |
—50.0 |
| Other creditors |
0.27 |
0.77 |
0.59 |
—0.18 |
—23.4 |
The reduction of accounts payable by RUB 1.5bn was mainly due to reductions in the following items:
- Suppliers and contractors (RUB 0.9bn). The deviation is due to repayment of debt to counterparts in accordance with the contractual liabilities.
- Taxes and levies (RUB 0.17bn), the debt is short-term.
- Advanced received (RUB 0.3bn), change of contract terms (abandonment of advance payments).
- Other creditors, reduction by RUB 0.18bn.
For control over discharge of contractual liabilities, reports on the flow of accounts receivable and accounts payable were made and analysed monthly. In the event of any debt of more than 30 days, steps were taken in accordance with the regulations.
Capital
Capital, RUB bn, 2014
The structure of capital of IDGC of Centre in 2012–2014 was as follows, RUB bn
| Parameter |
Measurement unit |
2012 |
2013 |
2014 |
Deviation, 2014/2013 |
|
|
|
|
RUB bn |
% |
| Equity |
RUB bn |
53.5 |
53.0 |
56.2 |
3.2 |
6.0 |
| Borrowed funds |
RUB bn |
45.6 |
52.0 |
55.2 |
3.2 |
6.2 |
| In particular: |
|
|
|
|
|
|
| Loans |
RUB bn |
26.4 |
33.1 |
37.2 |
4.1 |
12.4 |
| accounts payable |
RUB bn |
11.0 |
10.7 |
9.2 |
—1.5 |
—14.0 |
| Ratio equity and borrowed funds |
— |
1.18 |
1.02 |
1.02 |
— |
— |
| Share of borrowed funds in liabilities |
% |
46.0 |
49.5 |
49.6 |
0.1 |
0.2 |
| Cash at the end of the period |
RUB bn |
0.95 |
1.03 |
0.37 |
—0.66 |
—64.1 |
| Net debt |
RUB bn |
25.5 |
32.0 |
36.8 |
4.8 |
15.0 |
At the end of 2014, the equity of IDGC of Centre amounted to RUB 56.2bn, which was 50.4% of the Company’s total capital. The increase in the Company’s equity by RUB 3.2bn (in absolute terms) was due to a positive financial result of the considered year. In particular, net profit increased by RUB 3.0bn in comparison with 2013.
In 2014, the share of long-term liabilities in the capital of the Company was reduced to 32%, while in 2013 it amounted to 36%. The capital structure change was mainly due to the move of some loans that are due before the end of 2015 from long-term liabilities to short-term liabilities. The share of short-term liabilities in total liabilities by results of financial and business operations in 2014 amounted to 18%.
The net debt increased by 15% as a result of the increase of borrowed funds for funding the operating and investment activity of the Company by RUB 4.1bn.
Credit portfolio
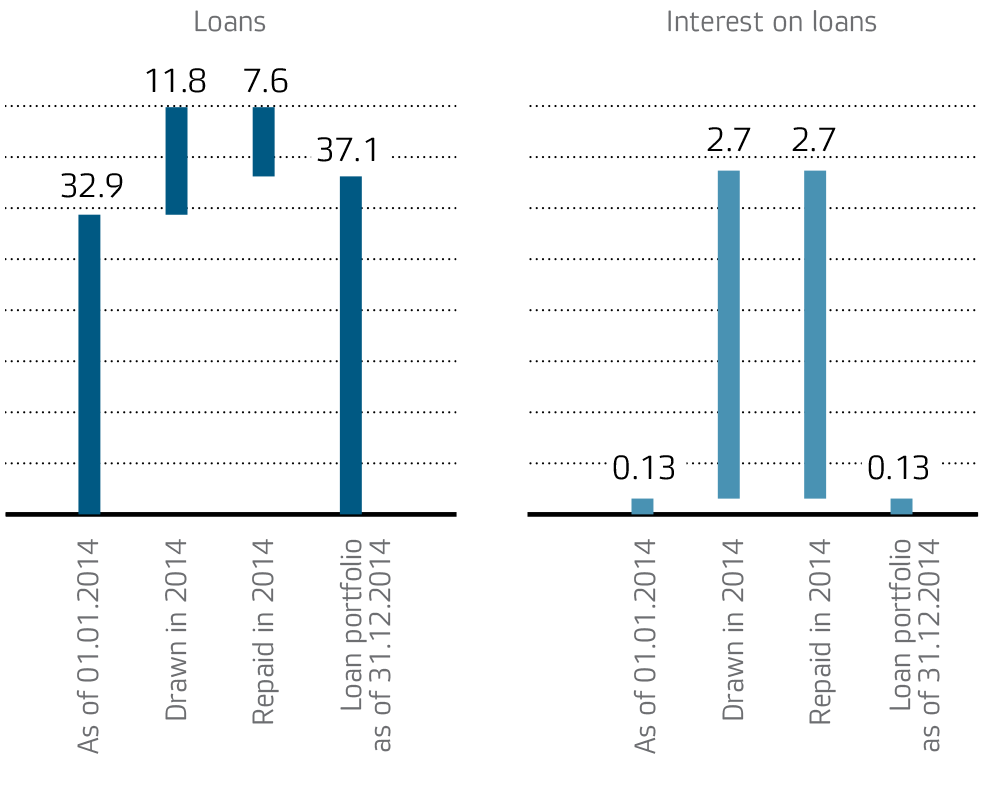
The emphasis of the credit policy of IDGC of Centre is on drawing long-term borrowings. The maximum maturity of loans that were drawn in 2014 is 37 months.
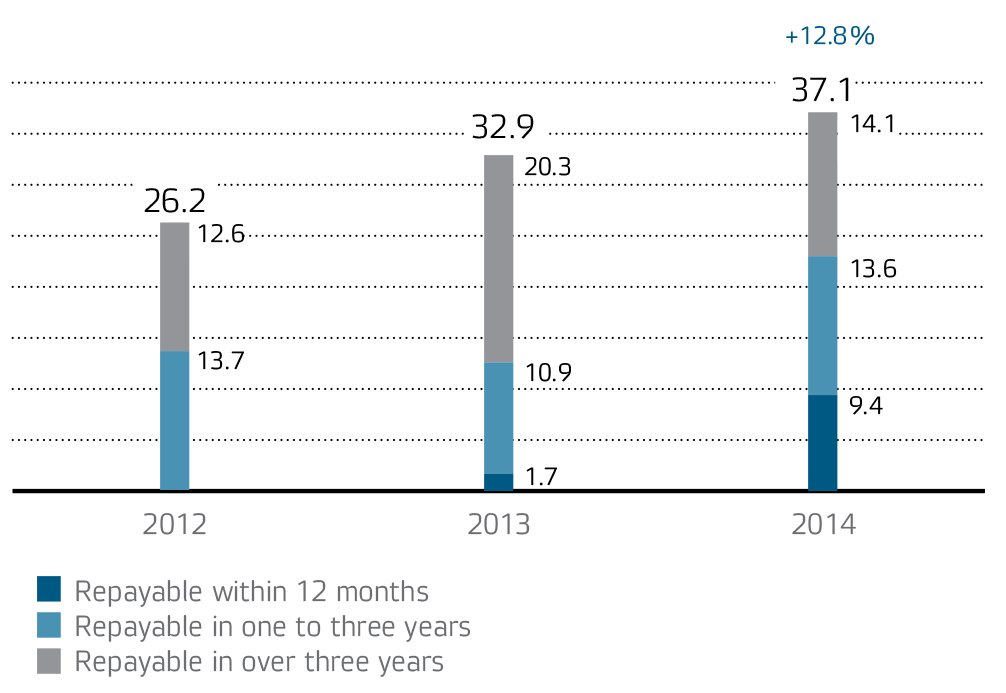
The increase of the loan debt in 2014 amounted to 12.8%, or RUB 4.2bn as compared to 2013; in 2013, it increased by 25.6% or RUB 6.7bn as compared to 2012.
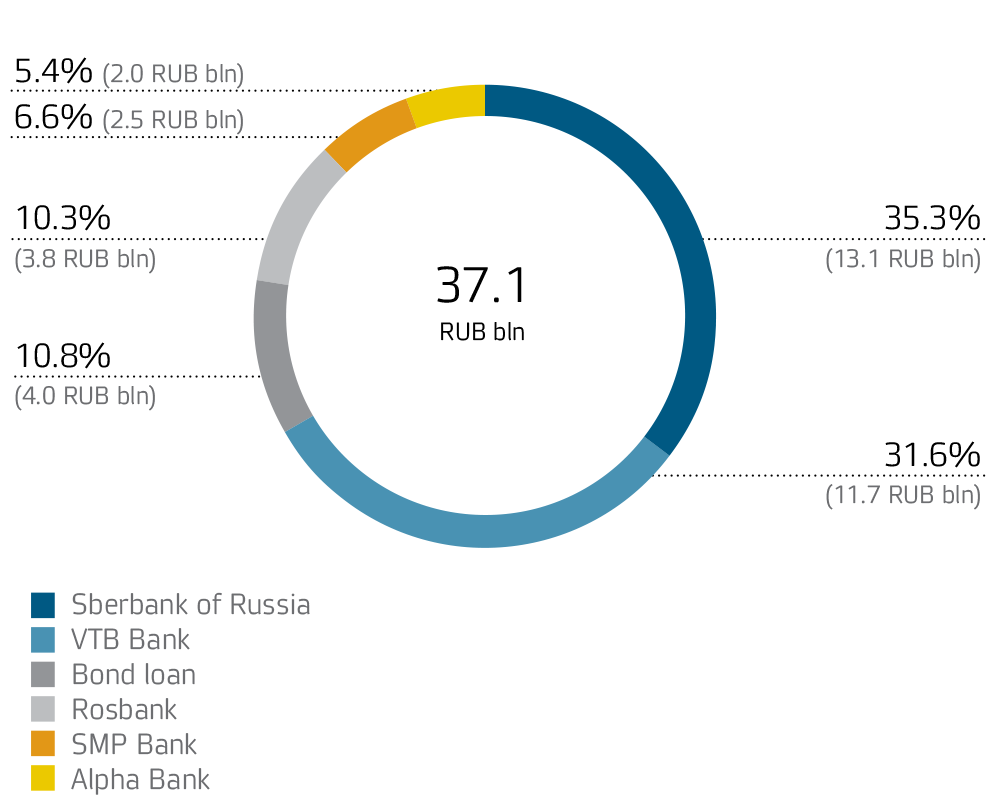
The main creditors of IDGC of Centre are major Russian banks with a high degree of reliability. The Company borrows most of its loans at VTB Bank, Sberbank of Russia, and Rosbank. In 2012, the credit portfolio was diversified with BO–01 stock exchange bonds placed for a total amount of RUB 4.0bn.
Credit portfolio diversification in 2014
The structure of the debt portfolio by maturities in 2012–2014 was as follows, RUB bn
The change of the credit portfolio in 2014 was as follows, RUB bn
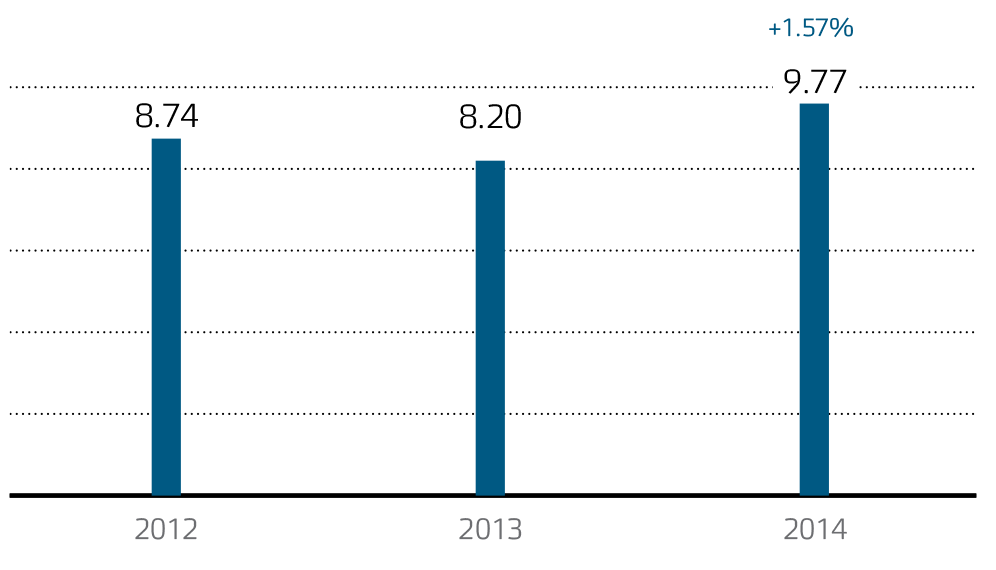
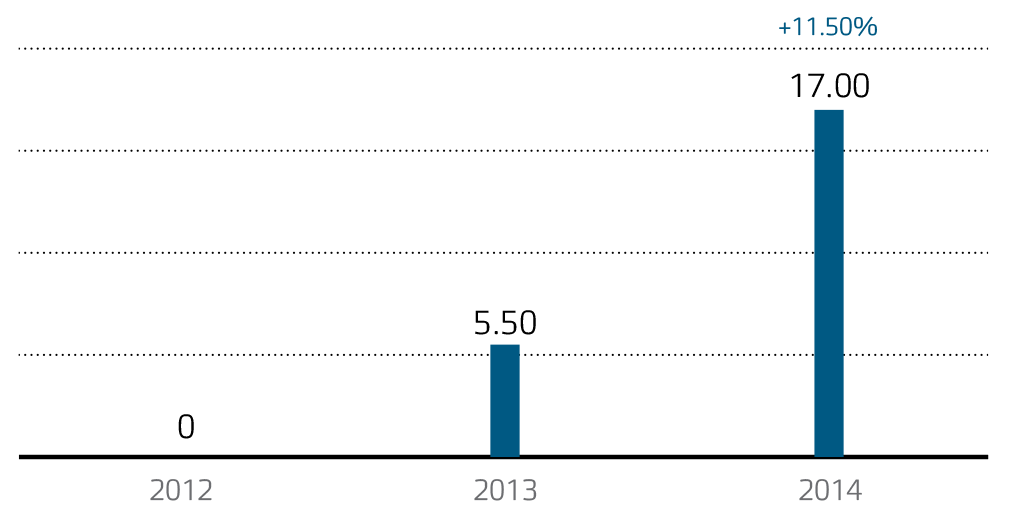
Weighted average rate
The increase of the average rate by 1.57 p.p. as compared to 2013 was due to the significant increase of the key rate of the Bank of Russia and the increase of the bank rates that followed.
IDGC of Centre takes its loans and borrowings without collateral.
Weighted average dynamics, %
Weighted average rate on all drawn funds (including the bond loan)
Weighted average rate on all drawn bank loans
Refinance rate of the Central Bank of Russia
Key rate of the Bank of Russia