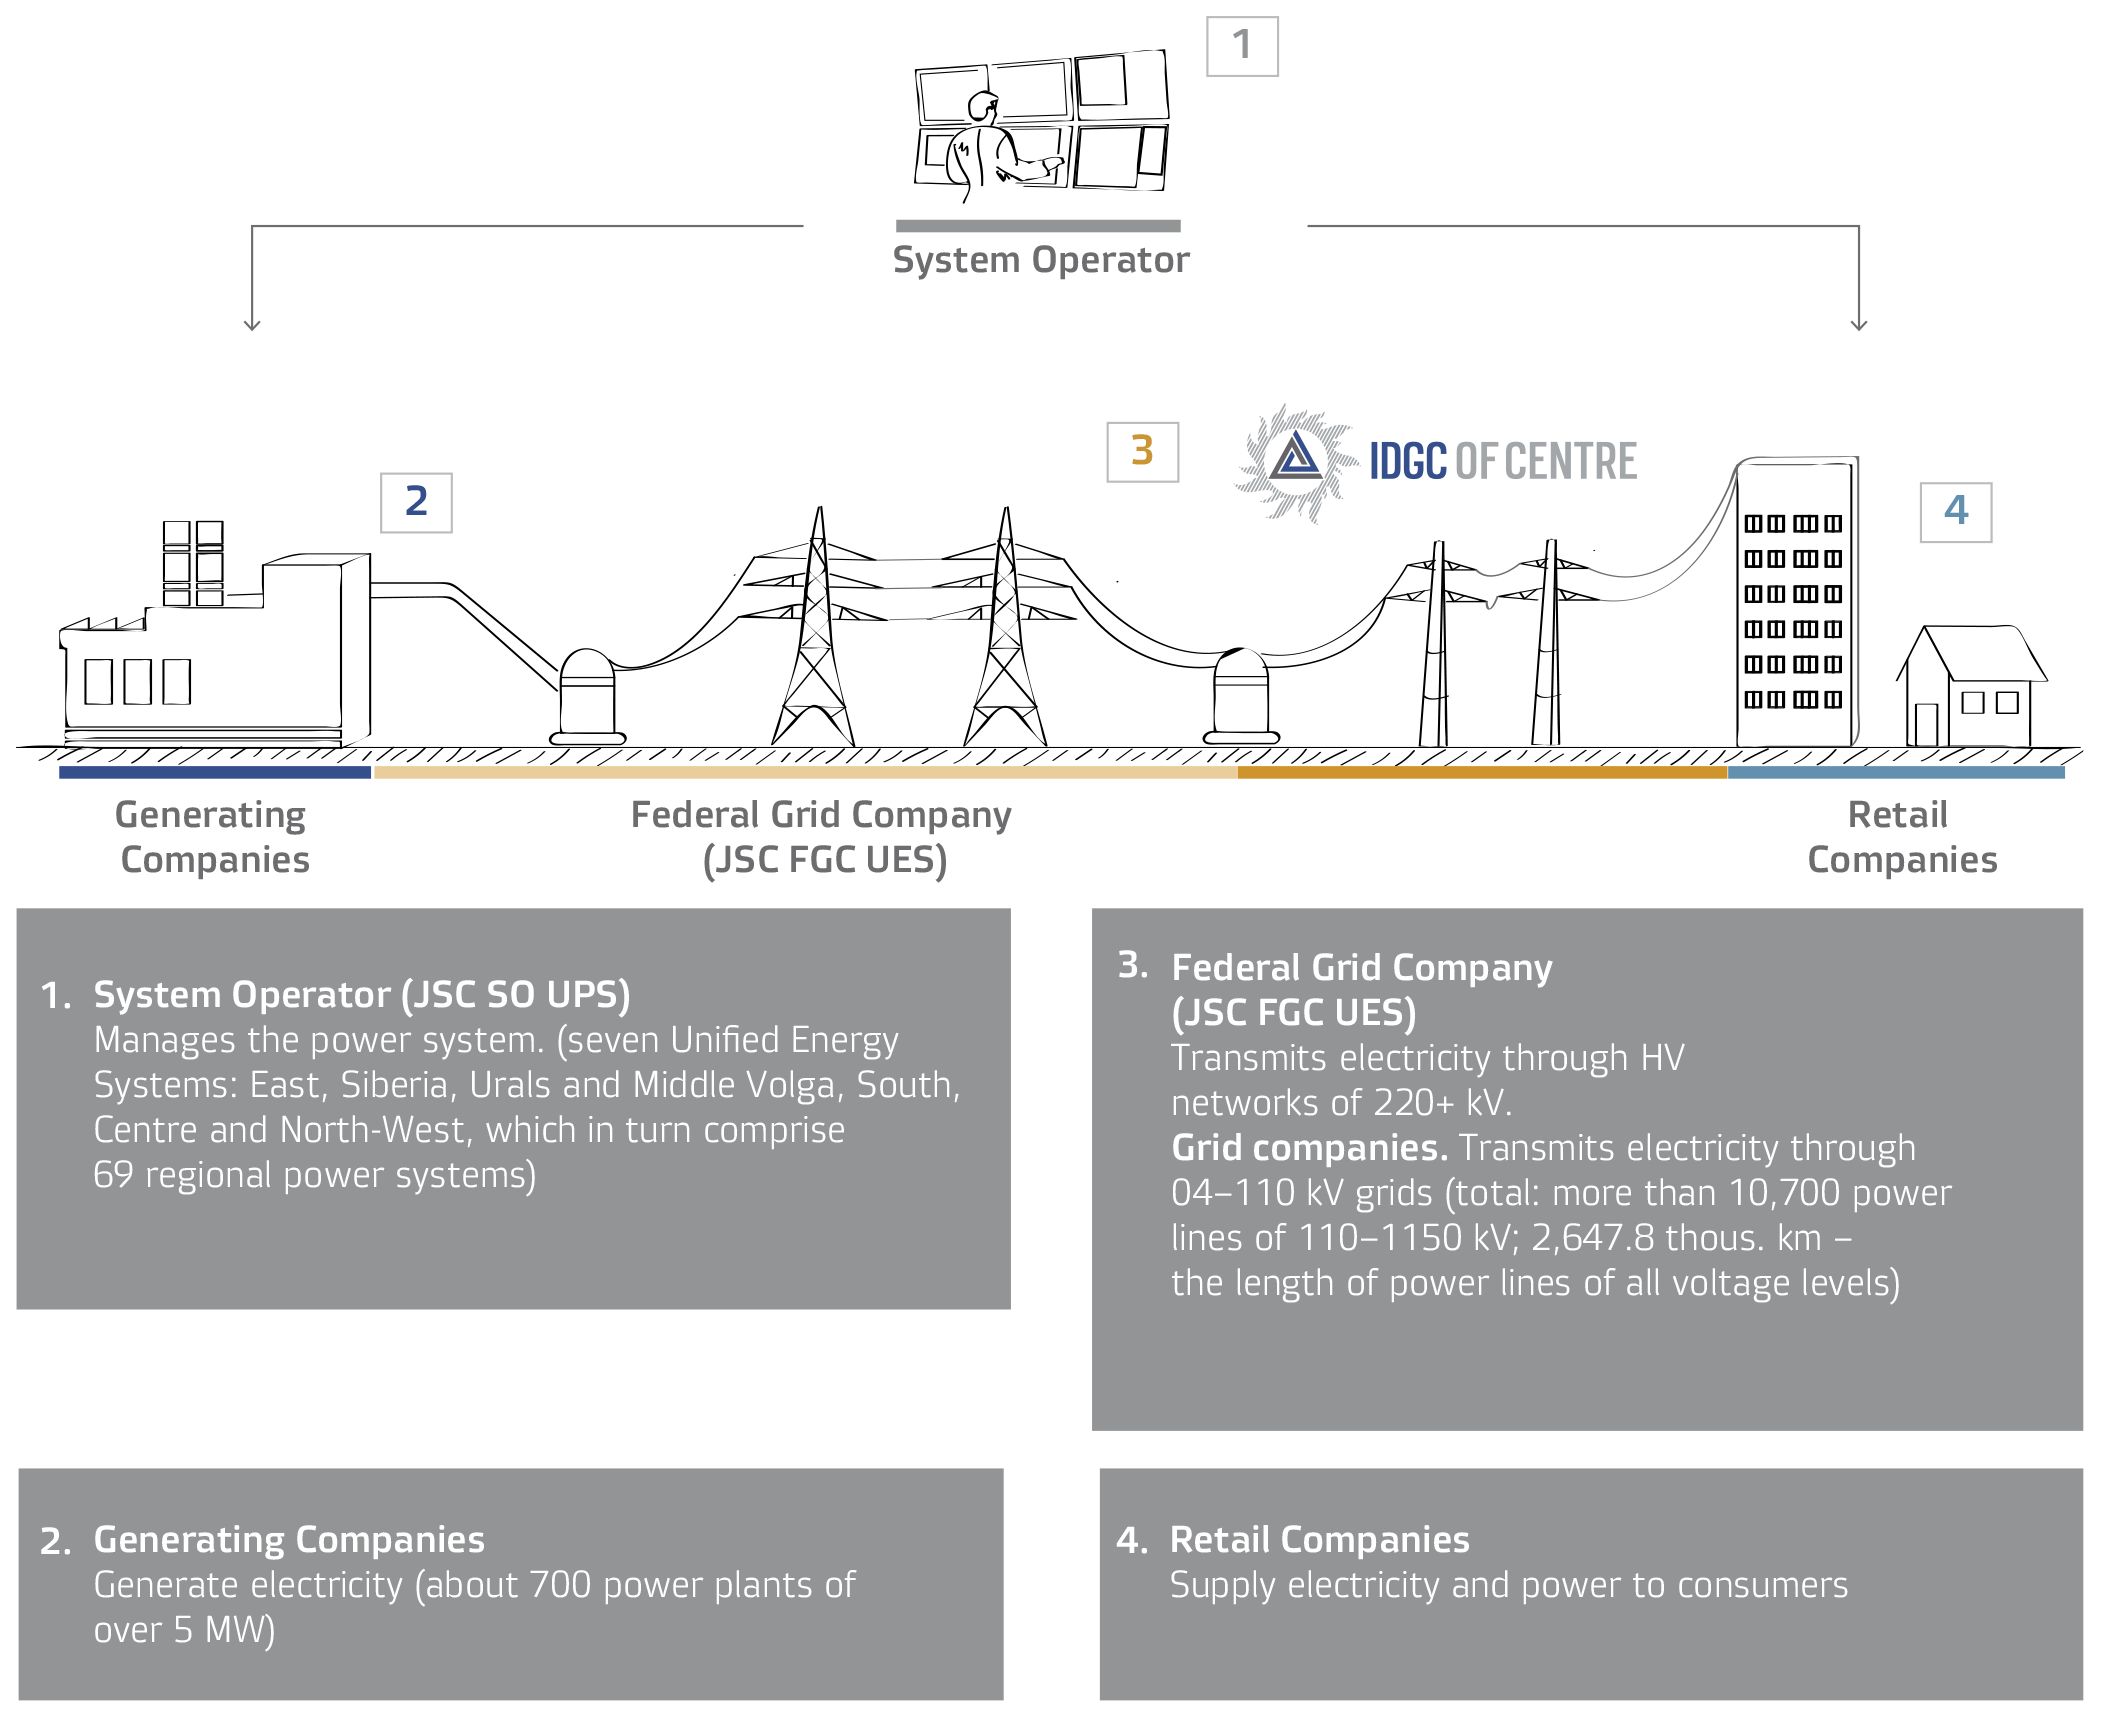
Structure of Russia’s Electric Energy Industry
The current model of the Russian electricity industry evolved in the 2000s, driven by the restructuring of JSC RAO UES of Russia, a single entity engaged in generation, transmission and supply of electricity and power. The reform resulted in creation of several independent joint stock companies divided by type of business.
Key Industry Indicators
The power sector is one of the leading sectors of the Russian economy, accounting for about 3% of Russia’s GDP. Therefore, the power sector is influenced by the economic situation as a whole.
Economic growth slowed sharply in 2014. According to preliminary estimates from Rosstat, GDP grew by 0.5% versus 1.3% in 2013. This slowdown was mainly caused by a decline in oil prices worldwide, as well as by EU and US sanctions imposed on Russia. GDP slowdown was also due to changes in consumption trends and fixed capital accumulation.
Development of industrial facilities in 2014 was characterised by stagnation in production, low productivity growth, a slowdown in fixed capital investment growth, and significant deterioration in the financial situation of enterprises, including their solvency.
The average annual growth rate of the Russian economy after the expected end of the oil crisis is estimated to be 3.5% in 2020–2030, which corresponds to the world economic growth rate.
The Electricity, Gas and Water Production and Distribution Index is expected to be 99.9% of the 2013 figure in 2014. Given the expected economic growth in Russia, by 2017, electricity production is planned to reach 1,077.4bn kWh (101.7% relative to 2013), while electricity consumption on the Russian market will increase to 1,071bn kWh (102.4% relative to 2013). Considering that electricity consumption on the domestic market is strongly related to temperature levels, the production and consumption rate may fluctuate in the range of 0.3 to 0.6% per year, depending on the temperature deviations from the long-term averages.
Changes in GDP depending on different scenarios of economic development according to the Ministry of Economic Development of Russia (average annual growth rate, percentage points)
Market Position
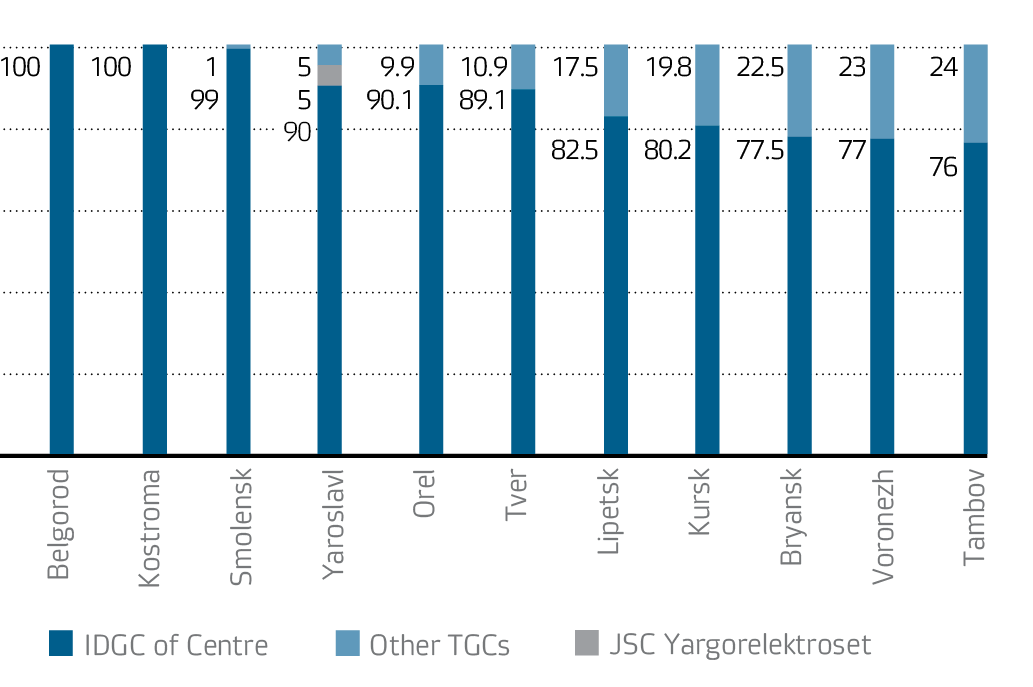
The Company holds a leading position in terms of services provided in the 11 regions of Central Russia where IDGC of Centre operates.
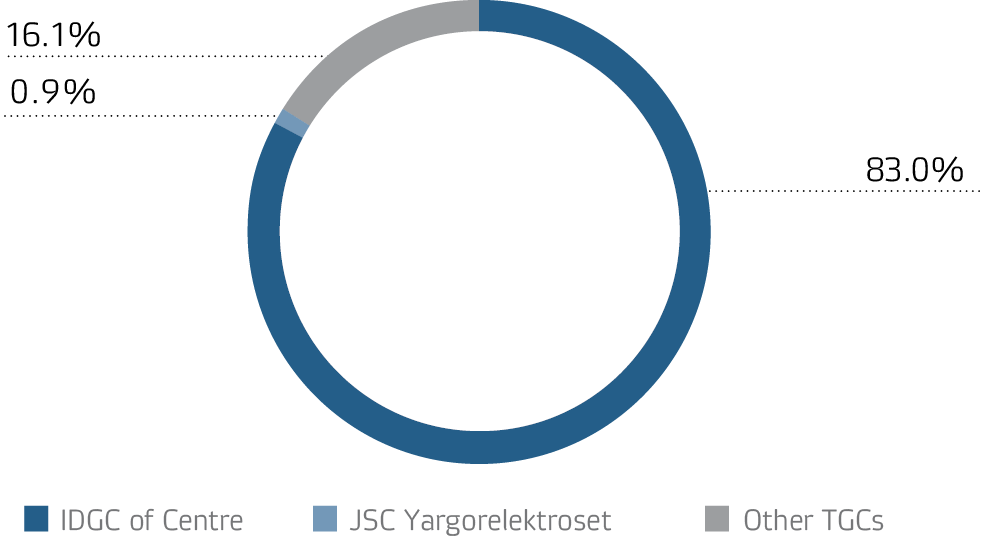
Share on the Electricity Transmission Market, %
Share on the Electricity Transmission Market, %
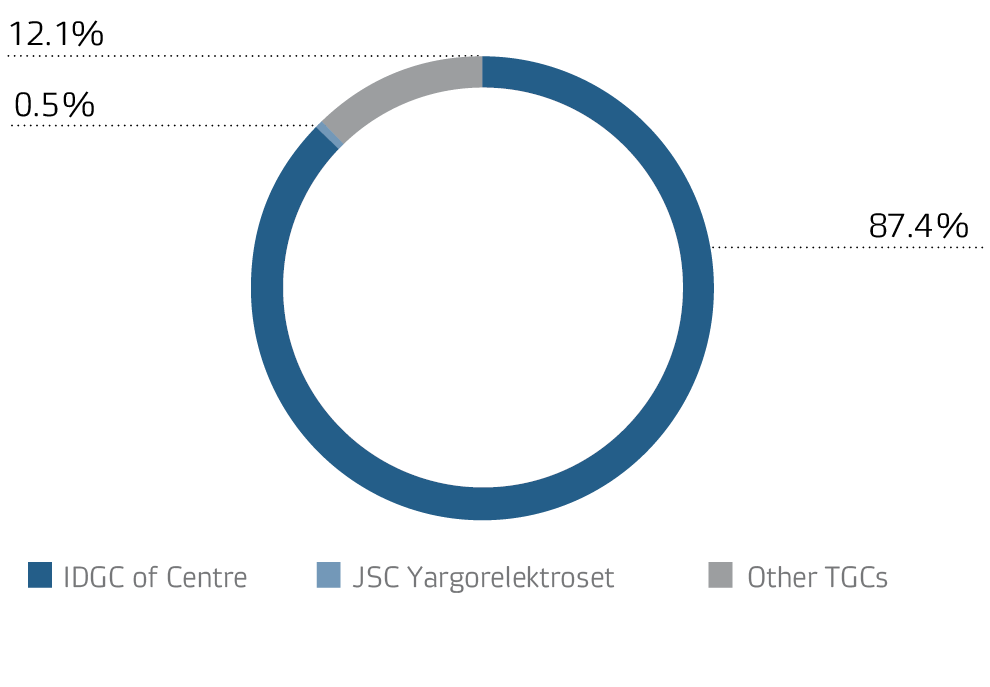
Share on the Grid Connection Market, %
Share on the Grid Connection Market, %
Major Competitors:
| 1. |
Belgorod |
Federal State Unitary Enterprise South-Eastern Railways (Belgorod) |
| 2. |
Bryansk |
Bryanskoblelectro LLC |
| 3. |
Voronezh |
Municipal Unitary Enterprise Voronezh Gorelektroset |
| 4. |
Kostroma |
Energoservis LLC (Kostroma) |
| 5. |
Kursk |
JSC Kursk Power Grids |
| 6. |
Lipetsk |
JSC Lipetsk Municipal Power Company |
| 7. |
Orel |
JSC Oreloblenergo |
| 8. |
Smolensk |
JSC ElS-Avance (Smolensk), JSC Oboronenergo (Smolensk) |
| 9. |
Tambov |
JSC Tambov Grid Company, JSC Tambov Utilities |
| 10. |
Tver |
Tveroblelektro LLC, Municipal Unitary Enterprise Tvergorelektro |
| 11. |
Yaroslavl |
JSC Yargorelektroset, JSC Rybinsk Municipal Power Grid |
Investment appeal factors
Based on numerous indicators, IDGC of Centre in one of the leaders in the distribution grid sector. This leading position is driven by key factors of the Company’s investment attractiveness:
- Present in 11 regions of Central Russia with sustainable economic growth persperctives.
- Leadership in innovations implementation in the sector.
- The development of additional services in electric energy sector.
- Dividend policy and positive dividend history.
- High level of corporate governance (LCG 7+). Information disclosure.
- High transparency.
- Sustainable financial position.
- Standard & Poor’s credit rating BB/B/ruAA.
- Reasonable credit policy: weighted average 9.77%.