ELECTRIC ENERGY TRANSMISSION
The Company holds the leading position on this market, and its market share, according to the 2014 end-year results, was 83.0% and 83.9%, taking into account the subsidiary JSC Yargorelektroset.
The calculation of electricity transmission services is carried out according to the same rates in each region regardless of which power grid company network the customer is connected to. Settlements between power grid companies are made according to individual rates, established for mutual settlements between pairs of power grid companies.
Customers perform payment transactions with IDGC of Centre for electricity transmission services provided based on uniform (boiler) tariffs. The company, in turn, makes payments for electric power transmission services to other territorial grid companies (TGC) in the region on the basis of individual tariffs.
The scope of power transmission
| Indicator |
Measuring units |
2012 |
2013 |
2014 |
Deviation 2014/2013 |
| kWh bn |
% |
| Power supply to the grid |
kWh bn |
64.0 |
63.6 |
62.8 |
—0.8 |
—1.3 |
| Net electricity supply (within the balance participation of the Company’s branches) |
kWh bn |
57.9 |
57.8 |
57.0 |
—0.8 |
—1.4 |
| Power losses |
kWh bn |
6.10 |
5.83 |
5.76 |
—0.07 |
—1.2 |
| Amount of power transmission services providedTaking into account electric energy sold over 2013–2014 when the Company was fulfilling the functions of the last resort supplier. |
kWh bn |
55.1 |
55.2 |
54.4 |
—0.8 |
—1.4 |
According to the end-year results in 2014, the amount of power transmission services decreased by RUB 0.8bn (1.4%) compared to 2013. The main reasons for the reduction in the amount of services provided is the termination of the last mile contracts in 2014, as well as reduction of energy consumption by the following customers.
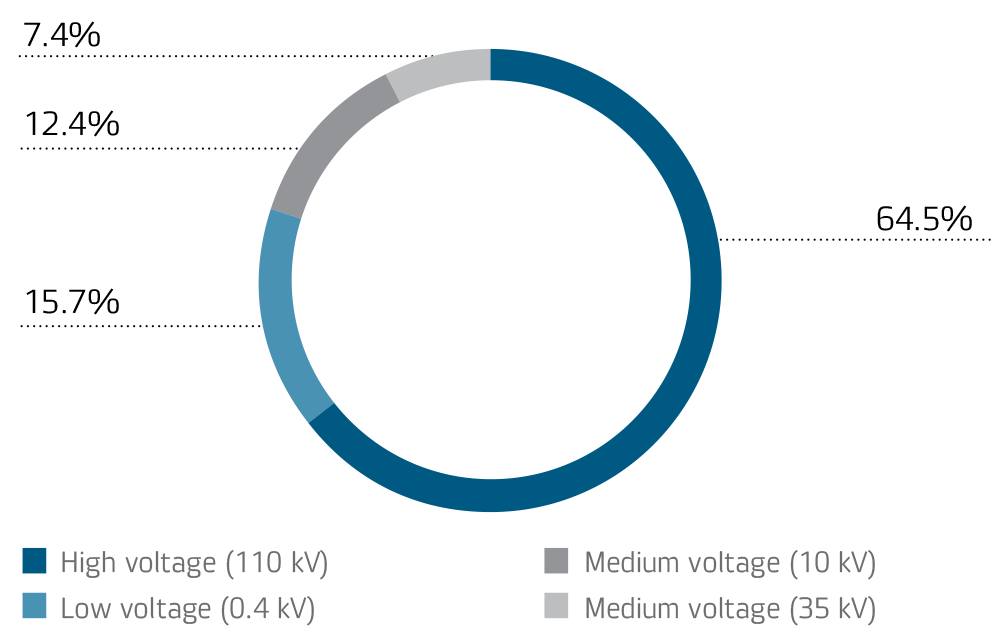
The major share of IDGC of Centre grid electricity supplies goes through 110 kV networks (64.5% of the total net electricity supply). Industrial enterprises account for 42.1% and TGC account for 43.6% of the total amount of 110 kV net electricity supply.
Electric energy supply structure in 2014 by voltage level
The largest high voltage (HV) enterprises belong to the metallurgical industry
|
Consumption in 2014, kWh bn |
Share of the total volume of productive electric energy supply from the grid of IDGC of Centre, % |
| Oskol Electrometallurgical Works |
3.4 |
6.0 |
| Novolipetsk Metallurgical Works |
3.0 |
5.3 |
| Mikhailovsky Mining and Metal Works |
2.4 |
4.2 |
Compared with 2013, there has been a decrease in high voltage electric power consumption due to exclusion from the balance sheet of the amount of electric energy transmitted to the last mile facilities: from 37,629.8mln kWh in 2013 to 36,831.5mln kWh in 2014. Moreover, this is due to reduced production by the following customers:
- Baltnefteprovod LLC, in the Yaroslavl Region, with a 95.6mln kWh (26.8%) decrease in power consumption.
- Gazpromenergo LLC, in the Tambov region, with a 75.5mln kWh (83.0%) decrease in power consumption.
- Gazprom Transgaz Moscow LLC, in the Lipetsk Region, with a 72.1mln kWh (85.8%) decrease in power consumption.
Among customer categories, the most part of electric energy is traditionally supplied to territorial grid companies (33.9%), industrial customers (32.4%), the general population and equivalent customer groups (11.2%).
See the Annual Report for details on key customers
There was an increase in power consumption by the general population in 2014 from 6,072.9mln kWh in 2013 to 6,399.5mln kWh.
In the industrial consumers group, consumption has decreased due to shifting away from the last mile structure: from 19,971.8mln kWh in 2013 to 19,491.5mln kWh in 2014. This reduction is also due to a reduction in production by a number of large companies.
Electric energy consumption from IDGC of Centre grid by the ten largest customers in 2014
| No. |
Branch name |
Customer name |
Consumed amount, kWh mln |
Share in the net supply, % |
| Net electric energy supply in 2014 |
57,045.0 |
100.0 |
| 1 |
Belgorodenergo |
OJSC Oskol Electrometallurgical Works |
3,436.9 |
6.0 |
| 2 |
Lipetskenergo |
OJSC Novolipetsk Metallurgical Works |
3,005.3 |
5.3 |
| 3 |
Kurskenergo |
KMA Electro LLC (OJSC Mikhailovsky Mining and Metal Works) |
2,404.1 |
4.2 |
| 4 |
Voronezhenergo |
SUE Voronezh Municipal Power Grid |
1,480.9 |
2.6 |
| 5 |
Bryanskenergo |
Bryanskoblelectro LLC |
1,411.9 |
2.5 |
| 6 |
Belgorodenergo |
OJSC Stoilensky Mining and Metal Works |
1,260.2 |
2.2 |
| 7 |
Yarenergo |
OJSC Yaroslavl City Electrical Grid |
1,227.8 |
2.2 |
| 8 |
Lipetskenergo |
OJSC Lipetsk City Power Company |
1,044.4 |
1.8 |
| 9 |
Voronezhenergo |
South-Eastern Railways (branch of OJSC RZD) |
999.7 |
1.8 |
| 10 |
Tverenergo |
SUE Tvergorelektro |
783.4 |
1.4 |
|
Total for the 10 largest customers |
17,054.6 |
29.9 |
Financial result
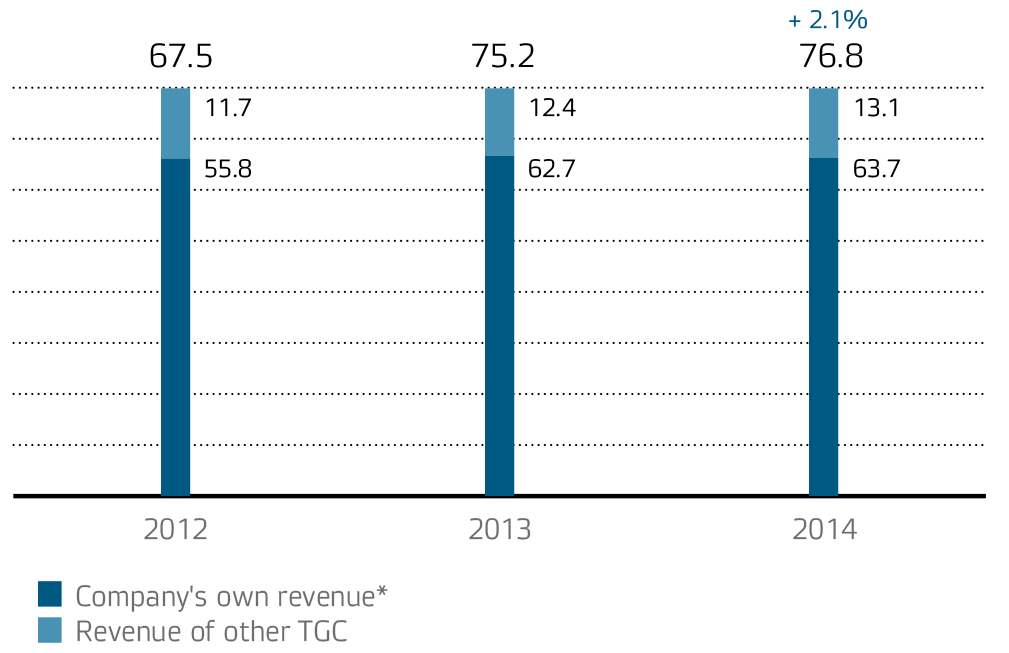
Customers make payments to IDGC of Centre for rendered electricity transmission services under uniform (“joint operation”) tariffs. The Company, in turn, makes payment for services for the transmission of electric energy to other TGC of a region region under individual tariffs.
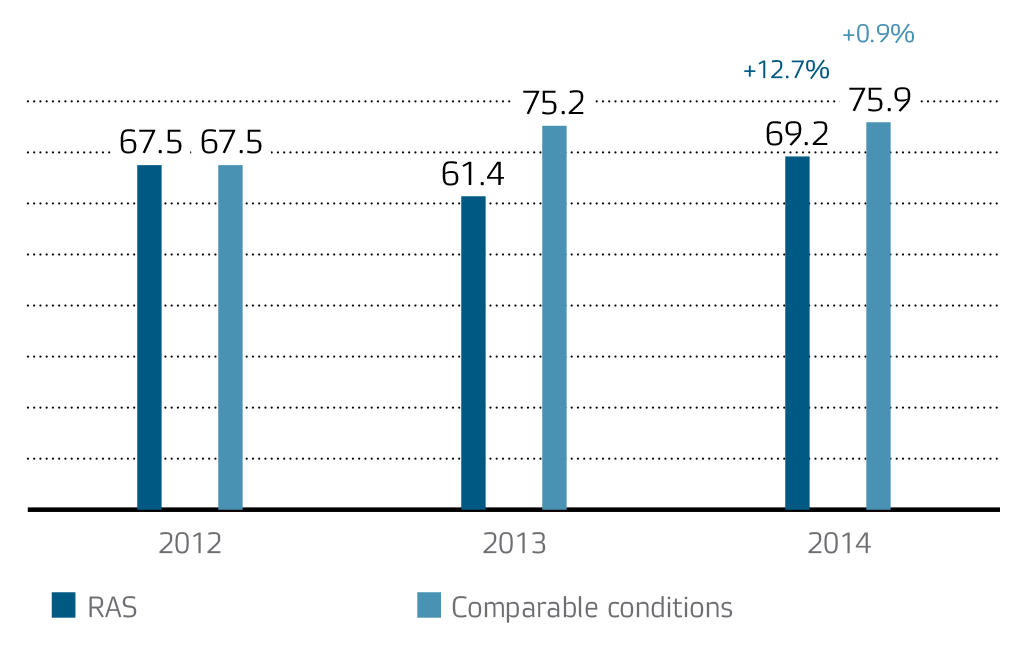
Due to IDGC of Centre’s fulfilling the functions of the last resort supplier in 2013–2014, and due to reflection of electric enegry transmission revenue as part of the electric energy sales revenue in the books, to compare the Company revenues received in 2013–2014 for electricity transmission services, data should be brought to comparable terms. The 0.9% increase in revenue from electric energy transmission services in 2014 was mainly due to the growth of tariffs in the reported year.
Electric energy transmission revenues, RUB bn
Since January 06, 2014, there has been a change in the boiler scheme on the territory of the Bryansk region in relation to payments between IDGC of Centre, the last resort supplier TEK Energo LLC, and the territorial grid organisation of Bryanskoblelektro LLC (boiler from below). Therefore, identification of the market share based on the revenue from IDGC of Centre electric energy transmission services and costs of settlements with utilities organisation (TCG) is incorrect. The information under comparable conditions is given below:
Revenue from power transmission, RUB bn
* This also includes the costs of electric energy transmission services provided by JSC FGC UES, as well as the cost of purchasing electricity for compensation of power losses in the networks of the Company.
Factors which caused reduction of IDGC of Centre’s own revenue in 2014:
- Reduction in the amount of net electric energy supply among other things due to last mile customers switching to direct settlements with JSC FGC UES.
- Reduction of the cross-subsidisation charge for last mile customers in the Belgorodenergo, Kurskenergo, Lipetskenergo and Tambovenergo branches, as well as limited growth in the electric energy transmission tariff for other customers who do not compensate the full amount of cross-subsidies.
- Furthermore, the mean electric energy transmission tariff growth rate is 7% slower than that of the cost of settlements with TGCs.
Production cost of electricity transfer services
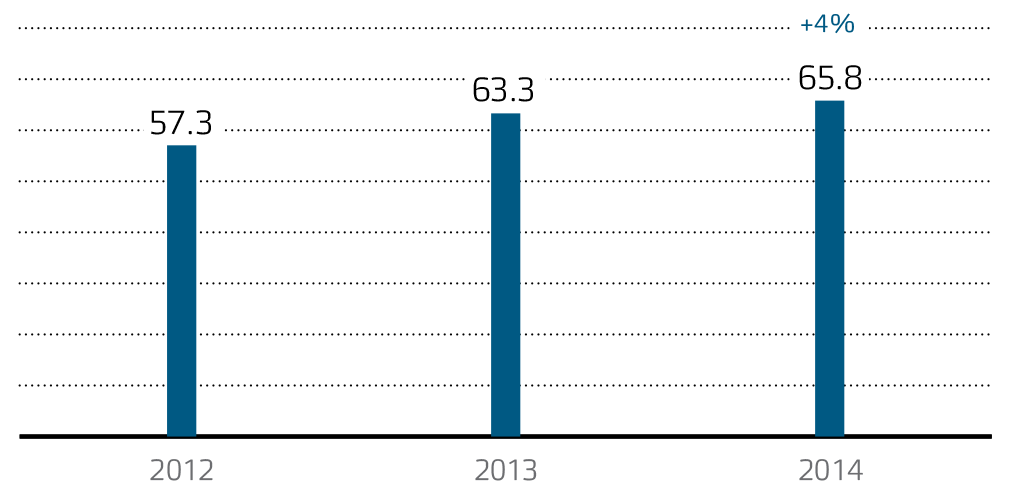
In 2014, the production cost of electricity transfer (in comparable conditions) amounted to RUB 65.8bn, which is a 4% increase in case of the production cost in 2013.
Dynamics of the production cost of electricity transfer services, RUB bn
The growth factors of the production costs of the main business type were as follows:
- +10.8%, increase of depreciation allowance due to commissioning of fixed assets in 2014 in the framework of the investment programme;
- +9.7%, increase of personnel costs due to salary indexation;
- +4.2%, increase of the electricity transfer service tariff in the United National Energy System from the side of JSC FGC UES.
Net profit
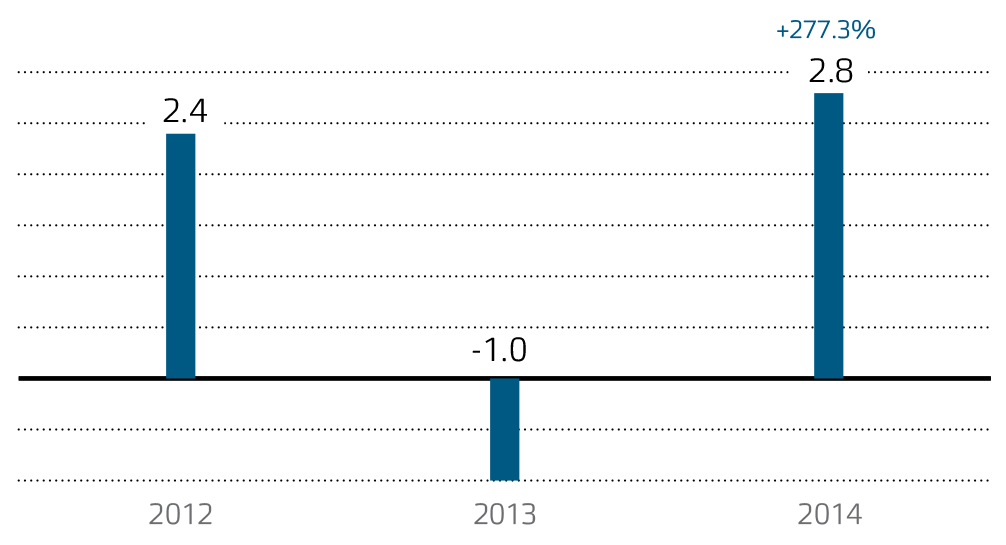
According to the end-year results, in 2014 the Company’s net profit from electric energy transmission services has increased by RUB 3.8bn, and has reached RUB 2.8bn. The key factors, which influenced the growth of electric energy transmission net profit, are as follows:
- RUB 722.9mln (1.0%) increase of revenues for electric energy transmission services.
- RUB 5,617.5mln (59.4%) reduction in the negative balance of other income and expenses due to creation of allowances for doubtful accounts.
The dynamics of net profit from electric energy transmission services over 2012–2014, RUB bn
Reduction of Energy Losses
The Company is implementing a set of measures aimed at optimisation (reduction) of electric energy losses as one of its business priorities.
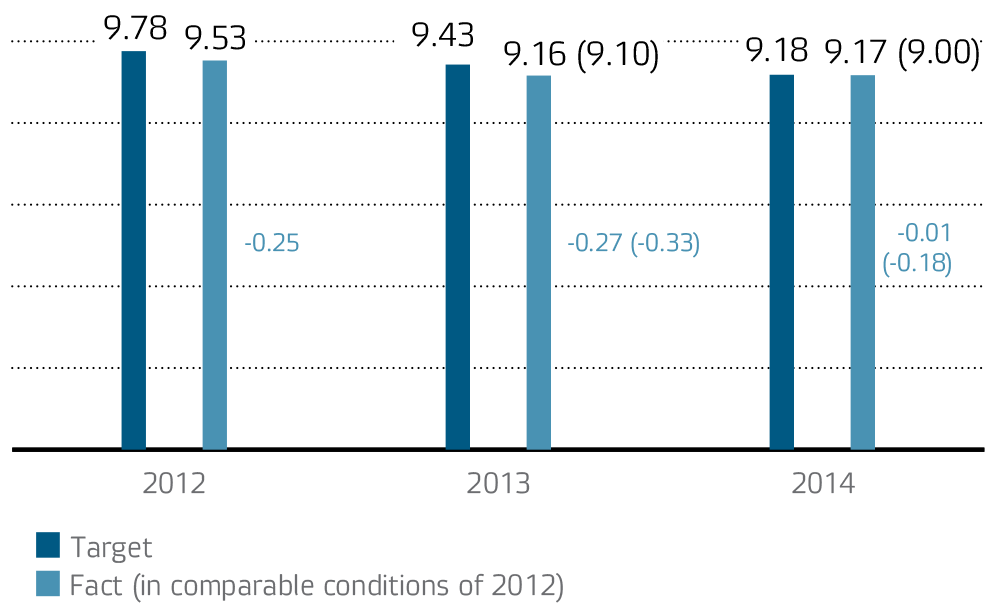
Actual losses of electric energy in grids of IDGC of Centre following the results of 2014 decreased in comparison with the last year by 1.2% and amounted to 5.76bn kWh.
In relation to the amount of electricity that was supplied to the grid by IDGC of Centre, in 2014 the losses amounted to 9.17%, and in 2013, 9.16%. Such dynamics is due to a reduction of the output to the grid, which was largely due to the exclusion of ‘the last mile’ facilities from the electricity balance in the amount of 0.7bn kWh. In conditions that would be comparable with 2012 (where ‘the last mile’ facilities would remain in the Company’s grid), the electricity losses would be reduced by 0.10 p.p., down to 9.0%.
The Company is implementing a set of steps for optimizing (reducing) the electricity losses. In 2014, it modernised over 15 thous. accounting points, having spent RUB 223mln not including VAT. Remote data collection from over 16.4 thous. accounting points was organised.
The measures being implemented can be divided into three groups: organisational measures, technological measures and measures for improvement of electric energy billing and metering systems.
Savings through implementation of loss reduction measures in 2014, % from the supply to the grid
Measures for reduction of electric energy losses in 2014 and their effect
| Measures |
Annual effect of loss reduction through measures fulfilled, kWh mln |
| 1. Organisational measures |
170.7 |
| Of which, key measures: |
|
| Including non-metered consumption into net supply (utilities) |
70.2 |
| Payment of non-contractual consumption (grids) |
26.7 |
| Transformer shutdown during low load at substations with two or more transformers |
8.05 |
| 2. Technological measures |
12.7 |
| Of which, key measures: |
|
| Replacement of overloaded transformers |
6.38 |
| Replacement of 0.4 feeders with self-supporting insulated wire |
1.25 |
| Replacement of wire with larger section at overloaded power lines |
2.5 |
| 3. Measures to improve electrical energy billing and metering |
13.2 |
Energy Conservation and Energy Efficiency Programme
In January 2014 the Company’s Board of Directors approved The Energy Conservation and Energy Efficiency Programme for the period 2014–2019 (Minutes dated February 03, 2014 No. 01/14).
The Program of Energy Conversation and Increasing Energy Efficiency of IDGC of Centre

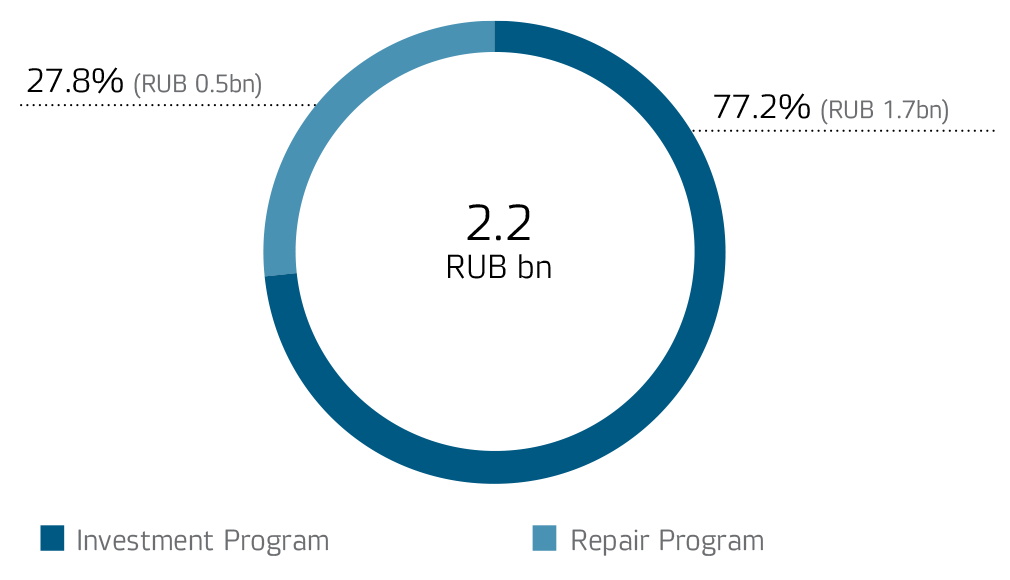
In 2014, the cost of implementing energy conservation measures and energy efficiency amounted to RUB 2.2bn. The Programme is financed through investment and maintenance programs of the Company.
Program implementation costs, RUB bn
Detecting Illegal Electric Energy Consumption
Aimed at electric energy loss reduction, IDGC of Centre implements measures for detecting non-contractual and non-metered consumption. In 2014, these measures brought about the following results:
Results of activities to identify illegal energy consumption, performed in 2014
| Non-contracted energy consumption |
3 thous. acts were drawn up and paid in the amount of 26.7 kWh mln |
Amount of recovery was 75.8 RUB mln |
| Non-metered energy consumption |
9 thous. acts were drawn up in the amount of 84.3 kWh mln |
Amount of recovery was 136.0 RUB mln |
| 8.9 thous. acts in the amount of 70.2 kWh mln were included in the volume of services rendered |
| Total |
|
211.8 RUB mln |
GRID CONNECTION PROCEDURE
IDGC of Centre carries out grid connection of new consumers to electric networks — physical and legal persons who intend to carry out commissioning connection, as well as already connected electric energy consumers, whose maximum power is increased. This type of activity is regulated by the State Regulation on grid connection of electricity consumers, objects for the production of electrical energy and power grid facilities owned by grid companies and other persons to power grids, as well as by establishing the amount of payment for grid connection to electric networks.
Scope of Services Provided
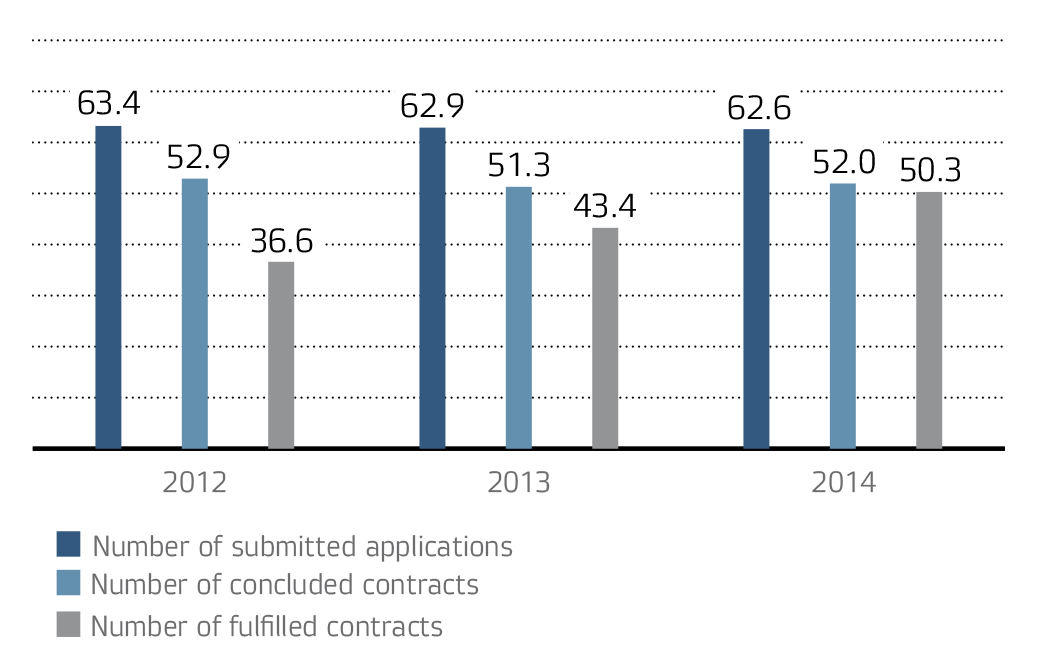
In 2014, IDGC of Centre received 62.6 thous. applications for technological connection of power receiving devices to electric grids, which is 0.5% lower than in 2013. However, the claimed power of accepted bids rose 3.1% compared to 2013, indicating demand from legal entities with higher connected capacity.
On the basis of applications filed in 2014, the Company entered into 52 thous. contracts for grid connection, which is 1.4% more than in 2013. At the end of 2014, despite the decrease in the number of applications filed, there was an increase in the number of contracts concluded as compared to 2013.
The positive dynamics in the number of contracts is the result of improving the quality of the Company’s services at the stage of conclusion of contracts, as well as greater awareness on the part of applicants of the procedure for the grid connection. This reduces the number of canceled orders, and most of the proposals end in a grid connection contract.
Fulfilment of grid connection applications, number of cases
Fulfilment of grid connection applications, MW
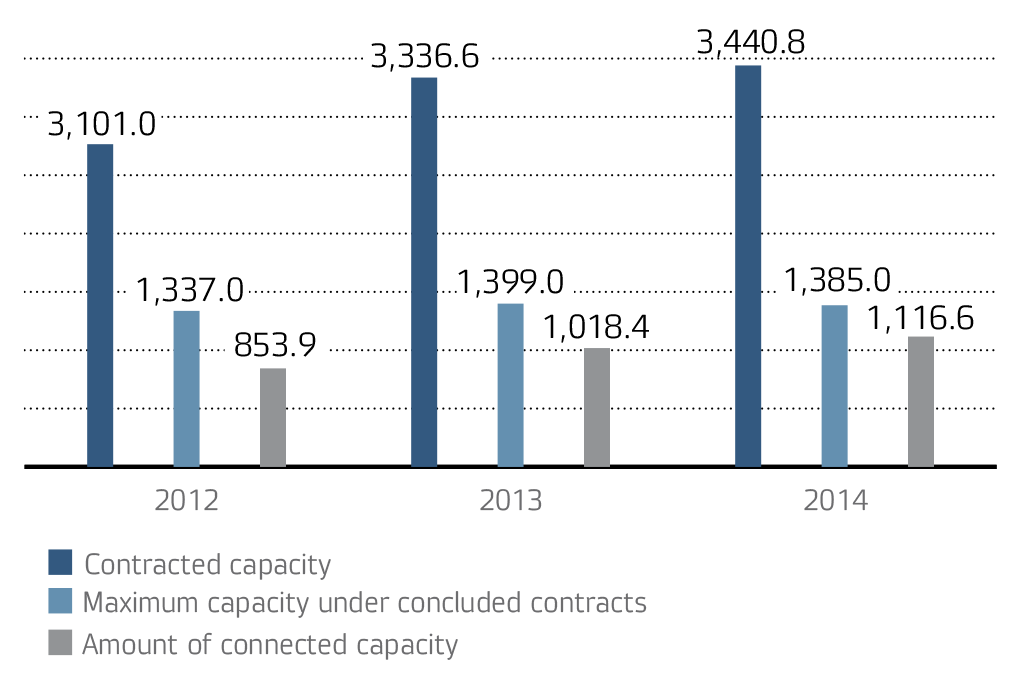
Contracted capacity dynamics by customer categories, MW
|
Up to 15 kW (subsidized category) |
15–150 kW |
150–670 kW |
Not less than 670 kW |
Generation |
Total |
| 2012 |
565.8 |
151.3 |
499.3 |
1,475.2 |
409.4 |
3,101.0 |
| 2013 |
607.6 |
183.5 |
444.3 |
1,707.5 |
393.7 |
3,336.6 |
| 2014 |
580.9 |
215.1 |
479 |
1,622.7 |
543.1 |
3,440.8 |
Connected capacity dynamics by customer categories, MW
|
Up to 15 kW (subsidized category) |
15–150 kW |
150–670 kW |
Not less than 670 kW |
Generation |
Total |
| 2012 |
331.7 |
54.7 |
137.2 |
289.3 |
41 |
853.9 |
| 2013 |
404.9 |
90.6 |
181.4 |
285.6 |
55.9 |
1,018.4 |
| 2014 |
490.7 |
96.6 |
161.8 |
359.9 |
7.6 |
1,116.6 |
In 2014, the Company executed 50.3 thous. contracts for grid connection, which is 15.9% higher than in 2013. The total amount of connected capacity in 2014 amounted to 1,116.6 MW. Such dynamics show the development of the electric grid and the increasing availability of energy infrastructure in the regions of service of IDGC of Centre. Every year an increasing number of contracts of grid connection are performed without measures for construction (reconstruction) of electric grid facilities from the network organization and the responsibility of the applicant to fulfill growing interest in connecting, respectively.
The increase in connected capacity in 2014 by 15.9% compared to 2013 is due to the acquisition in the reporting year of consumers with high peak power (6–10 MW). In addition, part of the large projects implemented with considerable declared capacity had been scheduled for execution in 2015, or were planned for 2013, but were implemented in 2014.
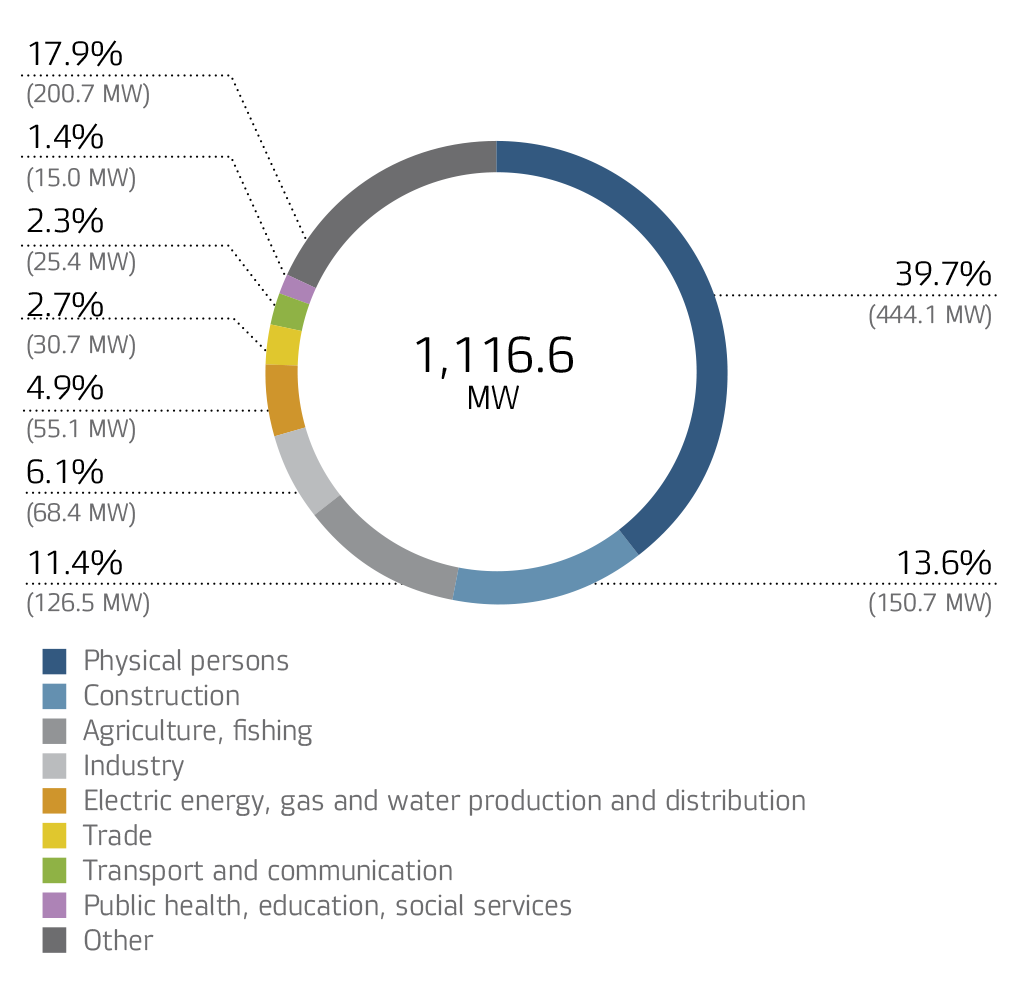
In 2014, the total volume of connected capacity of 39.8% came from contracts of grid connection of physical persons. In addition, quite a lot of weight is grid connection of construction at 13.5%, and agriculture at 11.3%.
Connected capacities structure by sectors in 2014, MW and %
Financial Results
In 2014, the revenue of IDGC of Centre from grid connection services increased by RUB 0.6bn or 66.7% in comparison with 2013. The revenue increase was due to implementation of numerous major projects in the reported year.
Due to the increase of the revenue from grid connection services, the net profit in the reported year increased by RUB 0.4bn or 80.0%.
The key parameters of the grid connection service business in 2012–2014 were as follows
| Parameter |
Measurement unit |
2012 |
2013 |
2014 |
Variance 2014/2013 |
| RUB bn |
% |
| Revenue |
RUB bn |
1.2 |
0.9 |
1.5 |
0.6 |
66.7 |
| Production cost |
RUB bn |
0.25 |
0.29 |
0.31 |
0.02 |
6.9 |
| Net profitAmount of grid connection liabilities includes in the financial statements as part of the net profit. |
RUB bn |
0.7 |
0.5 |
0.9 |
0.4 |
80.0 |
ELECTRIC ENERGY SALES AND CAPACITIES (performance of a guaranteed supplier function)
In 2013–2014, IDGC of Centre acted as the electric energy supplier of last resort on the territory of five regions of the Russian Federation, namely the Bryansk, Kursk, Orel, Tver and Smolensk regions.
This decision was taken due to the deprivation of the wholesale market participant from a number of energy sales companies working on territories of these subjects.
* A guaranteed supplier of electricity is a company which is obliged to conclude an electricity sale contract with any electricity consumer who applies or with a person who is acting on behalf and in the interest of the electricity consumer and is willing to purchase electricity pursuant to Federal Law No. 35-FZ dated March 26, 2003 or its own obligations.
In the first half of 2014, resort supplier functions were transferred to new retail companies — winners of the competition in five regions held by the Russian Ministry of Energy, with the exception of the control of Tveroblenergosbyt, for which the transfer of functions was carried out on 12.01.2014.
In this regard, overall in 2014 there was a decrease in revenue from this type of activity by 48.1% (in comparable terms). The company received a loss of services for the sale of electricity in the amount of RUB 788.3mln, which is lower than the financial result for 2013 by RUB 1,228.2mln.
Financial result from electric energy sales services
| Indicator |
Measuring units |
2013 |
2014 |
Deviation 2014/2013 |
| RUB bn |
% |
| Electrical energy sales revenue (RAS) |
RUB bn |
29.8 |
15.1 |
—14.7 |
—49.3 |
| Revenues from sales of electric energy (relative) |
RUB bn |
16.0 |
8.3 |
—7.7 |
—48.1 |
| Cost of electric energy sales |
RUB bn |
14.5 |
7.5 |
—7.0 |
—48.3 |
| Net profit |
RUB bn |
0.4 |
—0.8 |
—1.2 |
—179.2 |
The main factors that influenced the negative trend in net profit in 2013–2014 were:
- The decrease in revenues for this type of activity by RUB 7,684.6mln, or 48.1%.
- Reduction in production costs by RUB 6,808mln, or 48.3%, which corresponds to a reduction in costs under Purchase of electricity for sale, and conditioned by the transfer of the function of the guaranteeing supplier of electric energy in accordance with the orders of the Ministry of Energy of the Russian Federation on the territory of the Bryansk, Kursk, Orel, Tver and Smolensk regions.
- Reduction of sales expenses by RUB 534.8mln, or 45.0%, also due to the transfer of the function of the supplier of last resort of electric energy.
- An increase in the negative balance of other income and expenses RUB 1,193.5mln associated with the creation of reserves for doubtful accounts receivable.
- Change in income taxes of RUB 307.1mln.
Guaranteed Supplier Functions
When performing assignment of the Ministry of Energy of Russia in 2013, IDGC of Centre successfully implemented a set of measures to take on the guaranteed supplier (GS) functions, in particular:
- All employees of former guaranteed suppliers were employed by IDGC of Centre while keeping all job duties, salaries, and social benefits. All the workplaces are equipped with the necessary facilities and equipment as per labour law.
- The required contracts were made and regulatory procedures were implemented to provide access to the trading system of the wholesale electricity market; electricity for consumers was purchased in full. Payment for the electricity supplied from the wholesale market was effected within the time stipulated by the contract for joining the trading system of the wholesale market.
- Contract campaigns were completed as soon as possible for transferring consumers to the services of IDGC of Centre and making energy supply (sale) contracts with them.
- Contracts with organisations that take payments from private individuals were resigned to ensure timely acceptance of payments.
- The efforts of the two call centres for consumers’ claims and face-to-face customer service centres have been united, which enables each consumer to resolve any energy supply problem by contacting IDGC of Centre.
- Measures were taken to timely draft bills with the new bank details and send them to consumers.
To reduce the debt of energy sale companies who lost the GS status, IDGC of Centre worked on recovering consumer debts relating to liabilities of former GSs to secure further repayment of the debt for electricity transmission services to the Company.
The new type of business has resulted in a greater rate of electricity debt recovery and reduced losses.
OTHER ACTIVITIES
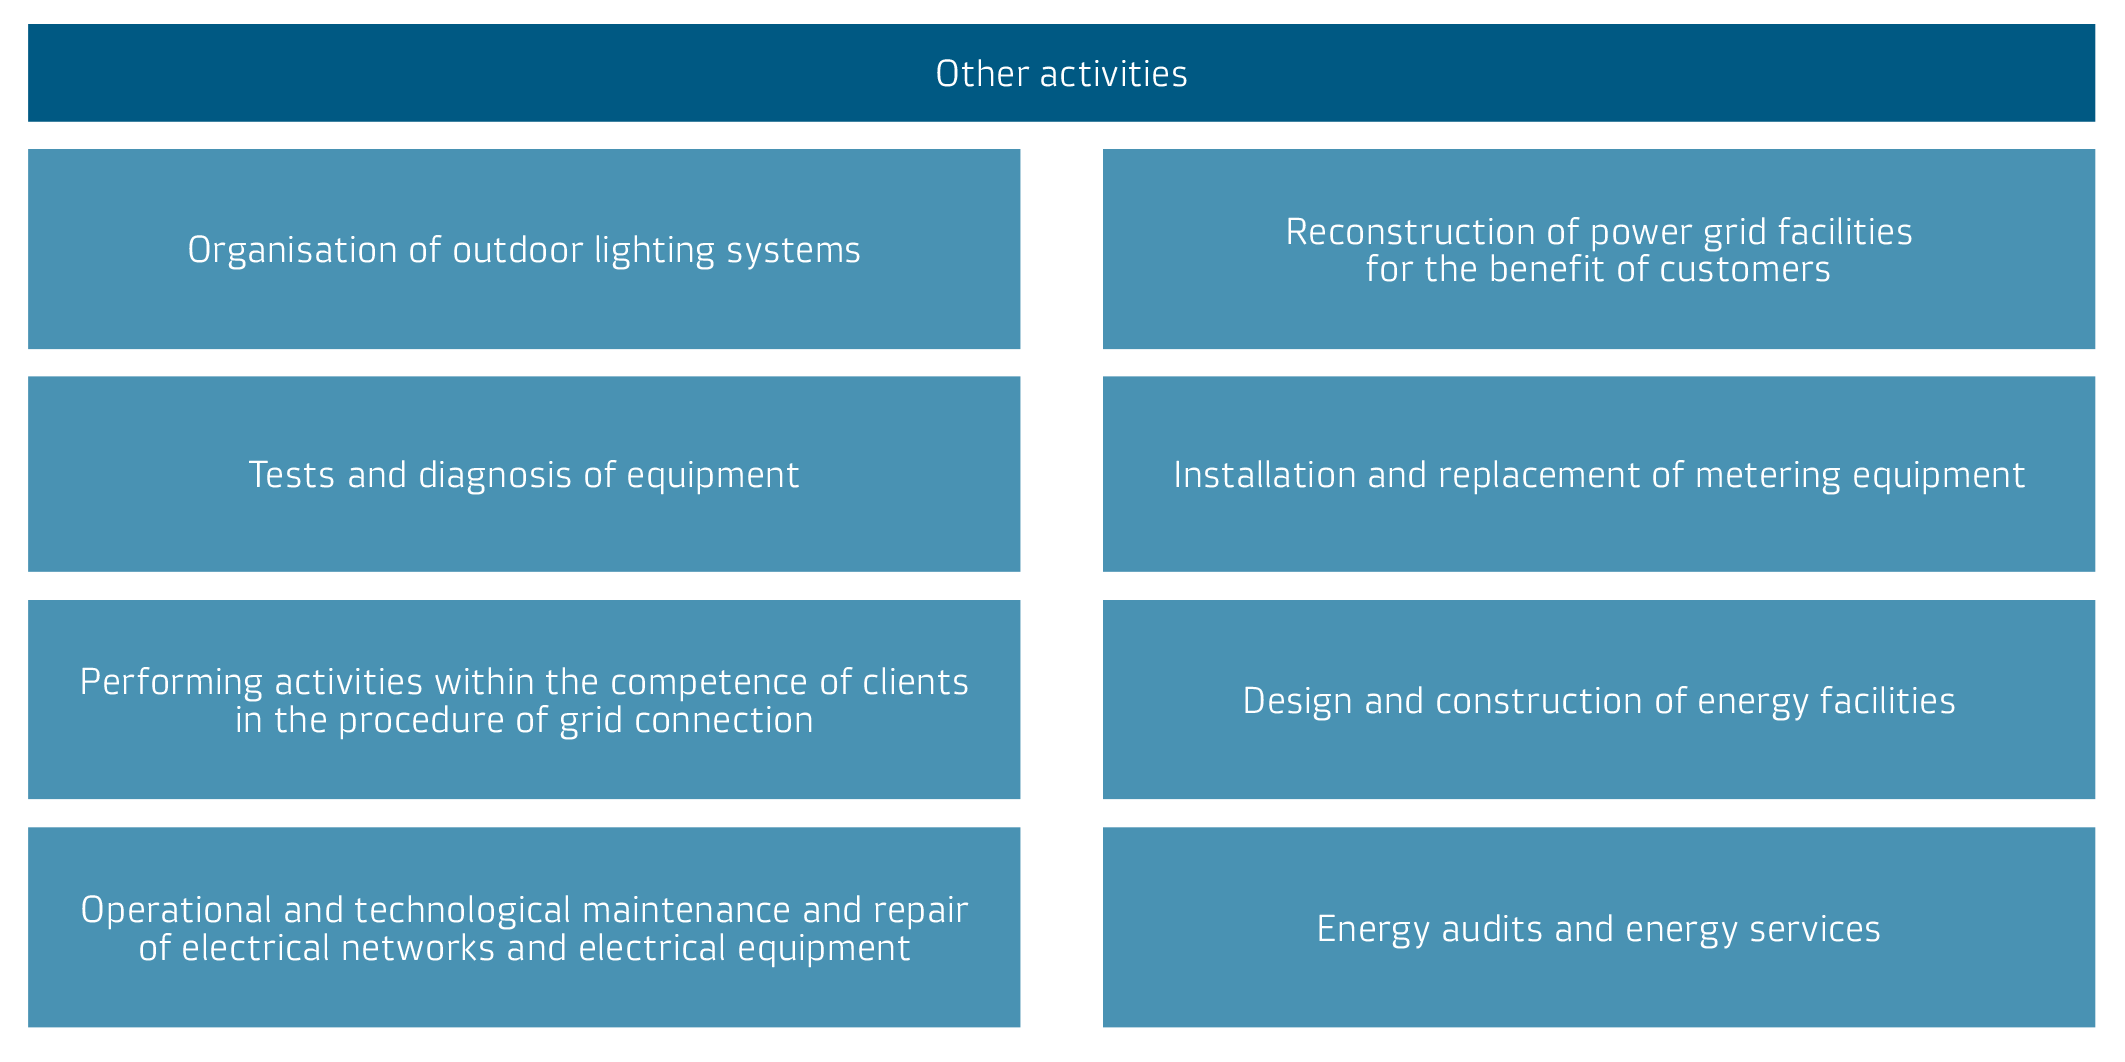
IDGC of Centre develops additional services rendered to customers and is not related to the core business of electricity transmission and grid connection. Additional services are paid and are not subject to mandatory government regulation.
Other activities
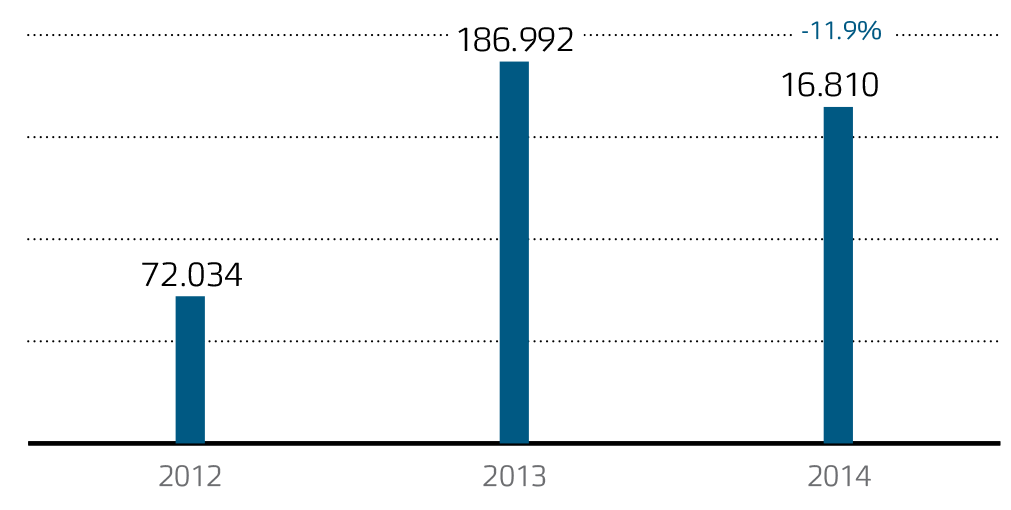
Customer complaints dynamics in 2012–2014, dealing with additional services, in thousand cases
Development of other activities
Taking into account the high importance of most services to the public, the Company seeks to expand the list of services and direct resources to maintain a high quality of customer service.
In 2014, with the reduction in demand for additional services by 11.9% compared to 2013, revenues from other activities increased by 8.3%. The increase in revenue is due to a greater extent to the development of commercial areas such as “Installation and replacement of metering equipment” and “Support technology connection”.
The main measures for the development of additional services in 2014 are as follows:
- Development of services characterised by strong competitive environment, by attracting contractors for execution of contracts. Involving contractors reduces the price of service and increases the efficiency of the provision of services.
- Unification works on the most popular services for meter installation/replacement: statement set routings, cost estimates, and the final price list for services. On its website, the Company provides cost calculator service for installation and replacement of metering devices.
- Entering into a commercial operation software package for analysis of the effectiveness of energy-efficient outdoor lighting. On the basis of market research, the Company identified ways of development, and formed a sales plan of services.
- Search orders on electronic trading platforms, in particular, on the court, Sberbank AST.
- Training in customer interaction active sales skills, which increased the share of concluded contracts on applications from filed consumers.
Activities planned for 2015:
- Revision of pricing for additional services in order to reduce costs.
- Introduction of additional crews to provide additional services to cover most of the services market with a strong competitive environment.
- Conduct market research of additional services from the perspective of the search for new directions of business development.
Financial results
In 2014, revenue from extra services increased by 8.3% while the demand for extra services reduced by 11.9% vs 2013.
The revenue growth is largely due to development of the business areas of Meter Installation and Replacement and Support of Grid Connection.
Revenue from extra services, RUB mln
